Article Text

Abstract
MRI is already an established diagnostic modality for assessing valvular stenosis although it is not usually used as the initial non-invasive test. The preferred diagnostic modality for valvular stenosis is currently echocardiography. However, MRI has been offered as a good alternative test in the event of inconclusive echocardiography results. During the course of valvular stenosis, the valve orifice area decreases and the pressure gradient across the diseased valve increases. Valvular orifice area is the major core indicator for valvular stenosis severity grading. Compared with valvular regurgitation, assessment with MRI for valvular stenosis is less complicated. The aim of this article is to detail the MRI techniques in assessing native and prosthetic heart valve stenosis.
- Valvular Disease
Statistics from Altmetric.com
Valvular stenosis assessment using MRI
Valvular stenosis is a common cardiac disorder and an important cause of cardiovascular morbidity and mortality.1 This condition produces volume and pressure overloading to the cardiac chamber upstream of the diseased valve.2 An increasing degree of valvular obstruction results in increasing velocity and pressure gradient of blood flow across the valve. The pressure gradient across the diseased valve is directly related to the valve orifice area.3 The core determinant factor for severity grading of valvular stenosis from any cause is valvular area. The stenotic cardiac valve will produce a turbulent jet flow into the receiving chamber downstream which is visualised as a dark signal void in gradient echo CINE MRI images. Peak flow velocity value and the pressure gradient flow across the diseased valve are also the parameters that indicate the degree of valvular stenosis severity. MRI can be used for direct measurement of stenotic valvular area and peak velocity of flow across the stenotic valve. A good correlation between MRI and echocardiography result and the reliability and safety of using MRI in valvular stenosis assessment were reported.4 ,5 Gradient echo CINE and gradient echo quantitative (Q) flow mapping MRI are still the key techniques to demonstrate the stenotic valve structure and to quantify the velocity of flow across the valve respectively.
Practical approach to MRI assessment of valvular heart stenosis
Direct measurement of valvular area by planimetry method
In the normal individual, the aortic and pulmonic valve areas vary from 2.5 to 4.0 cm2,6 ,7 mitral valve area (MVA) ranges from 4.0 to 6.0 cm2 and tricuspid valve area varies from 9.0 to 11.0 cm2.7 ,8 Evaluation of valvular stenosis severity using MRI is based on the criterion used in echocardiography as recommended by the American Heart Association (table 1). A stenotic valve will produce a high velocity jet flow running across the valve which is visualised as a dark signal void in the receiving chamber downstream of the valve on the CINE gradient echo MR images. Stenotic valve area measurement by direct planimetry method using MRI should begin with gradient echo CINE MR imaging to demonstrate the valve anatomy. The coronal plane image on gradient echo CINE MR imaging is the recommended reference image for aortic valve flow and area assessment. The true sagittal and horizontal four-chamber plane images are suitable as reference images for pulmonic valve and atrioventricular valve respectively.9 ,10 To obtain direct measurement of the valvular area, gradient echo CINE MRI or gradient echo quantitative (Q) flow mapping MRI is used. By using both techniques, the locator slice must be placed perpendicularly to the stenotic valve contour or to the blood flow stream line which runs across the valve and the width of the locator slice box should cover the most stenotic area. The gradient echo CINE MRI will provide the image of valvular area and valvular structure and the gradient echo Q flow mapping MRI will provide the information of both the valvular area and the peak flow velocity value data. The most stenotic lesion may be in any area along the basal to the tip of the valve that may lead to the difficulty of considering the exact location for positioning the locator slice box. Hence, to avoid error of the locator slice placing, the thickness of the locator slice box should be adjusted to cover all the entire length of the valve during the widest opening. However, the recommended thickness of the locator slice is about 8–10 mm to prevent partial volume effect but the length of the valve (from basal to the tip) during the widest opening may be beyond 10 mm especially the semilunar valves. The author would propose the double slice overlapping technique which is applied conveniently with gradient echo Q flow mapping MRI to solve this problem. By this technique, two Q flow mapping MRI scans must be performed. The first scan, the locator with the thickness of 8–10 mm, is aligned perpendicularly to the flow steam line and must cover the basal to the mid-part of the valve (the lower rim of the locator slice must be on the line between the basal insertion of the two valvular leaflets, ie, on the line between the basal insertion of the non-cusp and the left cusp of sinus of valsalva of the aortic valve on coronal view) and the second scan with the same slice width and direction as the first scan is aligned perpendicularly to the flow and covers the tip through the mid area of the valve. The mid-part of the valve is the overlapping part. With this technique, the most stenotic area (the area which produces the highest peak flow velocity) is certainly and confidently detected without missing it (figure 1). The gradient echo Q flow mapping MRI provides two sets of images, anatomical data images and flow encoding data images.11 ,12 The most stenotic valve area is specified by the area which produces the highest peak flow velocity. Delineation planimetry method is applied to the anatomical data image phase which corresponds to the highest peak flow velocity value. The double slice overlapping technique can be applied to any type of cardiac valves. Peak flow velocity assessment by using phase contrast Q flow mapping technique needs a suitable velocity encoding (VENC) speed which must be adjusted beforehand to avoid an aliasing in high speed measurement. VENC should be above the expected maximum velocity of flow.13 ,14 Double slice overlapping technique can be applied in use with gradient echo CINE MRI. The locator slice box of gradient CINE echo MRI is positioned at the same site and direction as in gradient echo Q flow mapping technique. As this method does not provide the flow velocity data, the cardiac phase of the most stenotic area of diseased valve during opening is determined by visualisation. The wrong cardiac phase of the most stenotic valvular area may be selected because of the error of visual estimation. Delineation of valve area of magnitude cine image is sometimes difficult because the border alignment of valve area may not be clearly seen. The author would recommend the modified aliasing technique for sharpening the valvular area rim. This technique is applied to the gradient echo Q flow mapping MRI by adjusting the dynamic flow velocity (VENC) to lower than the expected blood flow velocity of the particular valve to create aliasing effect. After gradient echo Q flow mapping sequence with modified aliasing technique is applied, in the phase images, the black signal of aliasing effect was seen at the centre of flow but in the CINE images, the dark signal of aliasing was seen at the valve area boundary (figure 2). By application of the modified aliasing technique, the valvular area boundary in anatomical images set of gradient echo Q flow mapping MRI is more prominent compared with the non-aliasing technique image. In the process of valvular stenosis evaluation using MRI, the double slice overlapping technique should be done before the modified aliasing technique to obtain the cardiac phase (at the particularly millisecond time, ie, cardiac phase at 533 ms) of the highest peak flow velocity. The CINE images of the modified aliasing technique in the same cardiac phase of the highest peak flow velocity obtained by the double slice overlapping technique is selected for valve area delineation by planimetry method. Delineation of valve area is easier on modified aliasing technique image compared with the conventional technique as well.15 For mitral and tricuspid valves, direct measurement of valvular area is obtained by planimetry method and both double slice overlapping technique and modified aliasing technique can be used. The most stenotic area of the atrioventricular valve is often caused by the structural change at the tip of the valve. The unequal spreading of the disease pathology may cause the difference in the length of each atrioventricular valve leaflet. Therefore, the locator slice thickness of MRI needs to be adjusted wide enough to cover the tip of all leaflets of the valve during the widest opening. The cardiac phase which shows the most stenotic valvular area during opening is the phase that corresponds to the peak velocity value of ‘e’ wave which is provided by gradient echo Q flow mapping technique. Measurement of the stenotic valve area by planimetry method is sometimes difficult in cases of heavily atherosclerotic and calcified valve because the valve area rim is blurred by atherosclerotic-calcified signal that causes difficulty in delineation and the modified aliasing technique cannot help. In assessing stenotic severity of heavy atherosclerotic-calcified valve, measurement of peak and mean flow velocity is recommended.
Classification of the severity of valvular stenosis in adults, American Collage of Cardiology/American Heart Association Practice Guidelines 2006

(A–C) Differences of peak velocity of blood flow across the valve and valve area of aortic valve at the different location (Tip level, Mid-level, Basal level). The narrowest area of the aortic valve is at the tip level. (D and E) Double slice technique which is applied to the gradient Q flow mapping MRI for flow and valve area measurement.
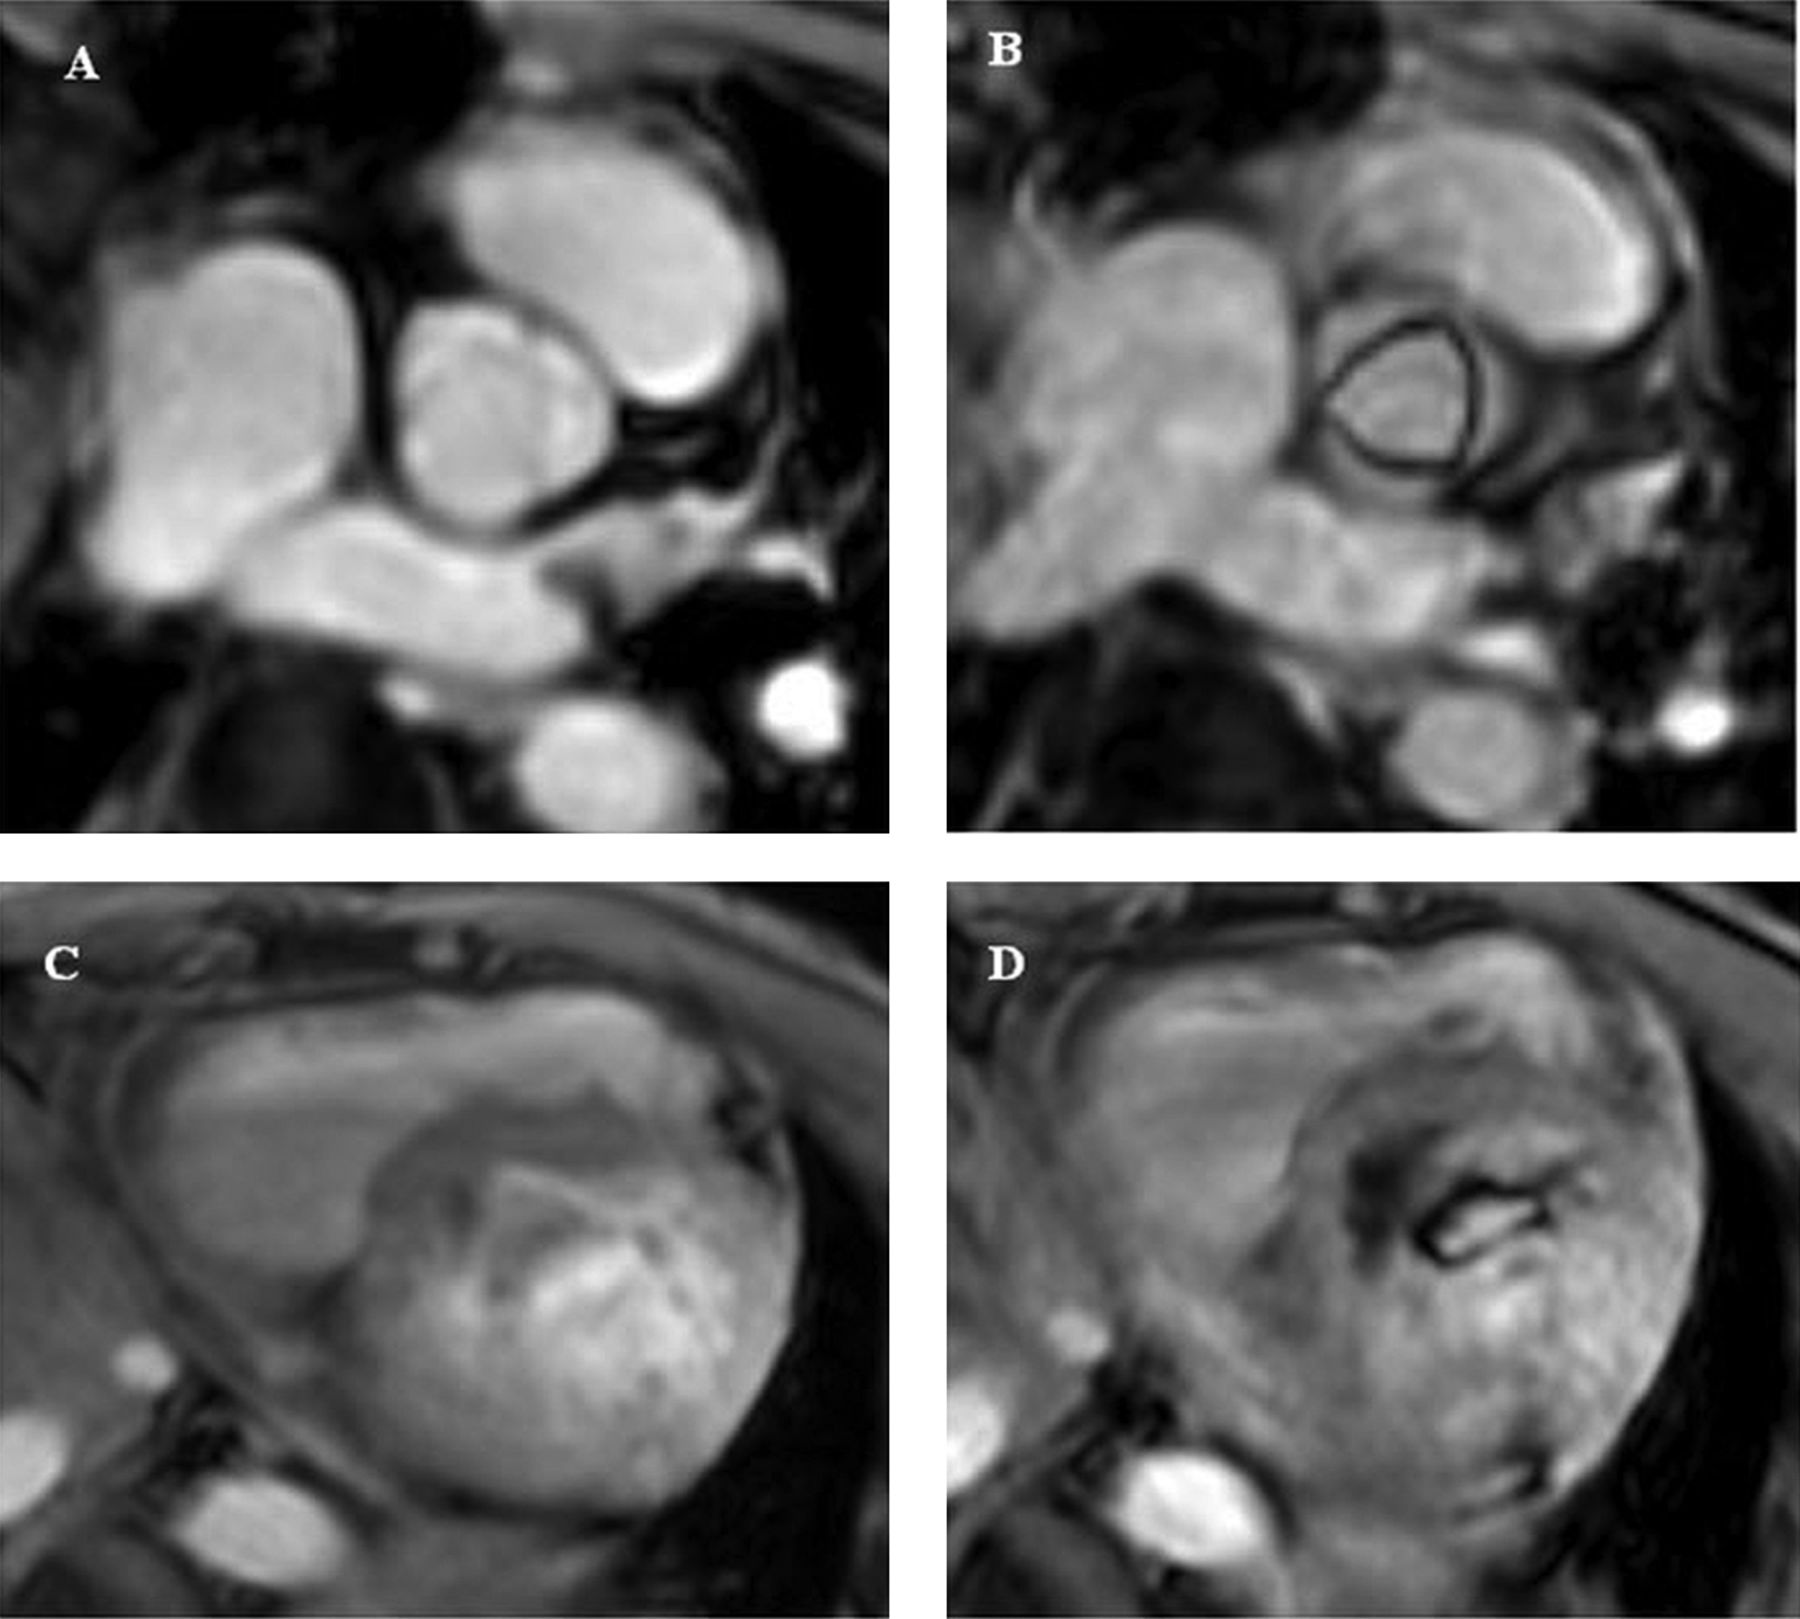
Demonstration of using modified aliasing technique for valve area rim sharpening, (A) Aortic valve area rim demonstration by using gradient echo Q flow mapping MRI without application of aliasing technique on the CINE data image set, (B) Aortic valve area rim enhancement demonstration by gradient echo Q flow mapping MRI with aliasing technique, (C) Mitral valve area rim demonstration by gradient echo Q flow mapping MRI without aliasing technique, (D) Mitral valve area rim sharpening demonstration by gradient echo Q flow mapping MRI with aliasing technique.
Forward flow velocity measurement
A simple method to evaluate the degree of valvular stenosis is to measure maximum flow or peak flow velocity of forward flow across the diseased valve. Peak velocity and mean velocity value of forward flow are obtained by using the gradient echo Q flow mapping MRI on the reference CINE gradient echo MR images and double slice overlapping technique is proposed to be used as mentioned above. Peak velocity of forward flow is about 1.0 m/s in normal aortic valve, 2.5–2.9 m/s in mild stenosis, 3.0–4.0 m/s in moderate stenosis and more than 4.0 m/s in severe stenosis.16 Peak velocity and mean velocity of forward flow can be used as parameters to calculate valvular area and pressure gradient of flow across the diseased valve by using continuity equation. Mean pressure gradient calculation is often used in mitral stenosis severity evaluation.
Calculation method for valvular area and pressure gradient across the stenotic valve
Continuity equation is commonly used to calculate aortic valve area and is also applied to calculate pulmonic and MVA.2 Pulmonic valve stenosis severity is not usually assessed by this calculation method. Bernoulli equation is used for pressure gradient calculation of any type of valves.2 To calculate pressure gradient across the valve will require peak or maximum velocity measurement of flow across the stenotic valve.
Continuity equation is based on the principle of conservation of the flow or stroke volume (SV) of one area must be equal to the second area if there is no shunt between two areas. It is used for valvular area calculation.17
 ***LVOT, left ventricular outflow tract; RVOT, right ventricular outflow tract; SV, stroke volume; Ao, aortic valve.
Ventricular outflow tract (VOT) area is obtained by planimetry method and VOT peak flow velocity measurement and its SV are obtained by using gradient echo Q flow mapping MRI. Coronal plane image of the aorta and true sagittal plane image in systolic phase (during valve opening widest) are recommended as reference images of area and flow assessment of LVOT and RVOT respectively. The locator slice is placed at the VOT area in systolic phase and the upper rim of the locator slice box must be placed on the line of two insertion points of the sinus of valsalva. VOT area is obtained by delineation of VOT area rim. Using ventricular SV obtained by gradient echo Q flow mapping MRI technique, the variability in the LVOT area calculation which involves with the squaring of the LVOT dimension that occurs in echocardiography can be overcome. Continuity equation can be also applied for MVA calculation: MVA=transmitral SV/VTI ms-jet (MVA=mitral valve area, SV=stroke volume (cm2), VTI=the velocity integral (cm) in the mitral stenosis jet (maximum flow velocity at peak E wave)).
Bernoulli equation is derived from the principle of conservation of energy. The sum of pressure and gravitational potential (p g h) is the same everywhere.18 This equation is applied for calculation of pressure gradient across the valve.
ΔP, the pressure drop across the stenotic valve (mm Hg); V, peak or maximum flow velocity (m/s).
Bernoulli equation can be applied to calculate pressure gradient of flow across any diseased valve. For mitral stenosis, valvular area can be calculated by using pressure half time (PHT) valve area; MVA (cm2)=220/PHT (T½, ms, time interval from the maximum mitral velocity (Vmax) to the point where the velocity fallen to Vmax/√2).2 PHT is defined as the time that it takes for the transmitral pressure gradient to decrease by half (P=Vmax/√2) and is calculated from the diastolic mitral inflow deceleration. Increasing pressure half times occurs with decreasing MVA, and this relationship is not influenced by additional mitral regurgitation.19 For the formula of deceleration time (DT)×0.29=PHT,20 DT is measured from the mitral velocity spectrum. DT is the time required for the velocity slope to fall from the peak (E) velocity to zero. Normally, the mitral velocity does not fall all the way to zero baseline and, therefore, the deceleration slope must be extrapolated to the zero baseline. PHT can be derived by multiplying DT by 0.29. This method is also called the simplified method for PHT. Vmax or maximum flow velocity and DT of the mitral valve is obtained by using gradient echo Q flow mapping MRI for transmitral inflow study.
Bernoulli equation can be applied to calculate pressure gradient of flow across any diseased valve. For mitral stenosis, valvular area can be calculated by using PHT valve area; MVA (cm2)=220/PHT (T½, ms, time interval from the maximum mitral velocity (Vmax) to the point where the velocity fallen to Vmax/√2).2 PHT is defined as the time that it takes for the transmitral pressure gradient to decrease by half (p=Vmax/√2) and is calculated from the diastolic mitral inflow deceleration. Increasing pressure half times occurs with decreasing MVA, and this relationship is not influenced by additional mitral regurgitation.19 For the formula of DT×0.29=PHT,20 DT is measured from the mitral velocity spectrum. DT is the time required for the velocity slope to fall from the peak (E) velocity to zero. Normally, the mitral velocity does not fall all the way to zero baseline and, therefore, the deceleration slope must be extrapolated to the zero baseline. PHT can be derived by multiplying DT by 0.29. This method is also called the simplified method for PHT. Vmax or maximum flow velocity and DT of the mitral valve are obtained by using gradient echo Q flow mapping MRI for transmitral inflow study.
Prosthetic heart valve stenosis
Prosthetic heart valve stenosis evaluation is similar to the evaluation of the native valve. Prosthetic heart valve replacement is commonly performed for the aortic and mitral valves.21 Artificial or prosthetic heart valve has two types, mechanical and bioprosthesis valves. MRI scanning of patients with ferromagnetic implants is still a major concern. MRI may be contraindicated for patients with ferromagnetic implants because of the relatively high risk of dislodgement of the implants related to MRI procedure.22 However, there are 32 types of mechanical valves which are considered safe for imaging in a 1.5 Tesla MRI because little heating and torque are produced.22 For the patient who has already an impaired prosthetic heart valve, cardiac magnetic resonance imaging may pose additional risk.23 MRI may be used to assess prosthetic complications such as valve thrombosis, valve dehiscence, pseudoaneurysm, infectious endocarditis or paravalvular abscess. This article will detail the role of MRI in detecting prosthetic heart valve obstruction. Defining prosthetic valve obstruction by measuring prosthetic valve area by planimetry method using MRI is not recommended because of streak artefact from surgical clips and wires that may limit the ability of delineating valvular area. In addition, streak artefact also limits the ability to identify thrombus or vegetation on the prosthetic leaflets. Assessing severity of prosthetic heart valve by quantification of peak velocity of flow across the prosthetic valve is the most convenient way. In the measuring of peak velocity of flow across prosthetic valve using gradient echo Q flow mapping technique, the slice box thickness must be adjusted to cover the thickness of the prosthetic valve and also the double slice technique can be used if the thickness of the artificial valve is beyond 8–10 mm (figure 3). Mild stenosis of prosthetic valve after replacement is acceptable in any kind of artificial mechanical valves.24 The normal range of flow across the artificial valve depends on the type and size of artificial valve.25
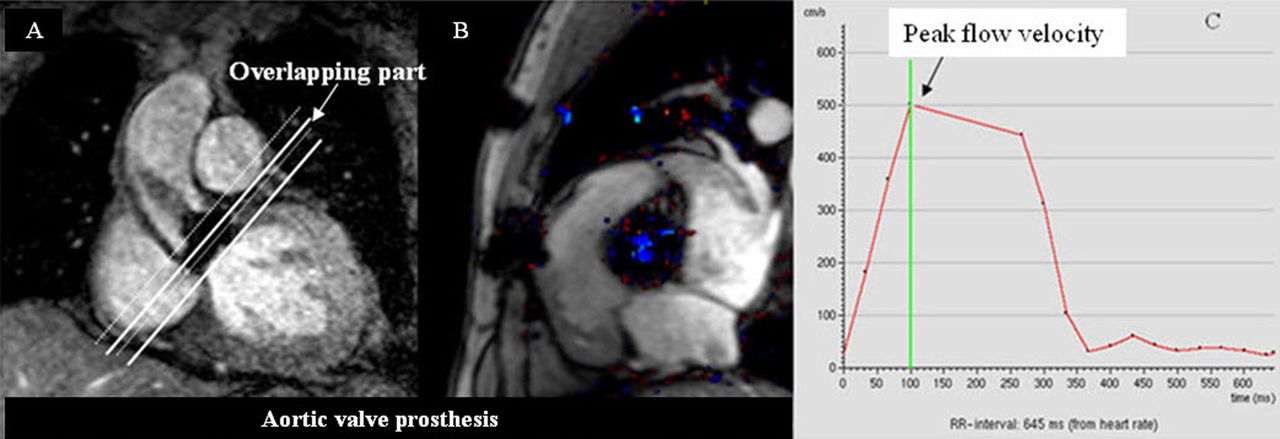
(A) Prosthetic aortic valve stenosis evaluation by flow measurement using gradient Q flow mapping MRI with double slice technique application. (B) Prosthetic aortic valve demonstration on the anatomical image data set of gradient echo Q flow mapping technique. (C) Demonstration of peak velocity of flow across the prosthetic aortic valve by using of gradint Q flow mapping MRI technique.
Conclusions
To assess severity of cardiac valvular stenosis using MRI, optimal reference cardiac plane and phase selection including correct positioning of locator slice are very important factors to determine the accuracy of measurement result. Besides being a useful modality for the assessment of cardiac valves, cardiac MRI will become an increasingly important diagnostic modality for other heart diseases.
Acknowledgments
The author thanks Dr Gumpanart Veerakul, the president of the Cardiovascular and Prevention Center, Bhumibol Adulyadej Hospital, Royal Thai Airforce, Bangkok, Thailand, and Dr Kit V Arom, the former director of Bangkok Heart Hospital, Bangkok, Thailand, for the encouragement. Thanks to nurses and technicians of cardiac imaging unit, Bangkok Heart Hospital, Bangkok, Thailand, for the great support.
References
Footnotes
-
Funding None.
-
Competing interests None.
-
Provenance and peer review Not commissioned; internally peer reviewed.