Article Text

Abstract
Objective Little is known about the relationship between body composition indicators, including body mass index (BMI), fat mass index (FMI) and lean BMI (LBMI), and adverse outcomes after percutaneous coronary intervention (PCI) in Asian populations. The aim of this study was to clarify this relationship.
Methods The SHINANO registry is a prospective, observational, multicenter cohort registry that enrolled 1923 consecutive patients with coronary heart disease (CHD) from August 2012 to July 2013; 66 patients were excluded because of missing data. We evaluated 1857 patients with CHD who underwent PCI (aged 70±11 years; 23% women; BMI 23.8±3.5 kg/m2; LBMI 18.3±1.8 kg/m2; FMI 5.4±2.2 kg/m2). Patients were divided into three groups, based on BMI, LBMI and FMI tertiles, to assess the prognostic value of the three indicators. The primary endpoint was major adverse cardiac events (MACE), including all cause death, non-fatal myocardial infarction and ischaemic stroke at 1 year.
Results Over a 1 year follow-up period (1776 patients, 95.6%), the cumulative MACE incidence was 8.7% (161 cases). Using Kaplan–Meier analysis, the MACE incidence was significantly higher in patients with lower BMI values (13.4–22.2 kg/m2) (p=0.002) and lower LBMI values (11.6–17.6 kg/m2) (p<0.001); this trend was not observed for FMI. Multivariate Cox regression analysis showed that lower LBMI but not lower BMI values were predictive of a higher MACE incidence (HR 1.55; 95% CI 1.05 to 2.30).
Conclusions Lower LBMI values are associated with adverse outcomes in an Asian population with CHD undergoing PCI. LBMI is a better predictor of MACE than BMI or FMI.
Clinical trial registration UMIN-ID; 000010070.
- CORONARY ARTERY DISEASE
This is an Open Access article distributed in accordance with the Creative Commons Attribution Non Commercial (CC BY-NC 4.0) license, which permits others to distribute, remix, adapt, build upon this work non-commercially, and license their derivative works on different terms, provided the original work is properly cited and the use is non-commercial. See: http://creativecommons.org/licenses/by-nc/4.0/
Statistics from Altmetric.com
Introduction
Obesity is a well known mortality risk factor among the general population,1 and has been described as one the most visible yet neglected public health problems.2 Obesity is commonly assessed by body mass index (BMI), with underweight (BMI <18.5 kg/m2) and obese (BMI ≥30.0 kg/m2) individuals having a higher incidence of coronary artery disease.3 In particular, higher levels of obesity (BMI ≥35.0 kg/m2) are significantly associated with a higher incidence of all cause mortality.4 Although BMI is a simple tool for assessing obesity, differentiating fat mass (FM) content from skeletal muscle mass, or lean body mass (LBM), is difficult using the BMI calculation, especially in patients with a BMI value <30 kg/m2.5 Therefore, BMI assessment may misclassify individuals with excess adipose tissue as being non-obese. Sex, age and race have also been reported to alter the relationship between BMI and mortality.6
A previous report demonstrated an inverse correlation between LBM and mortality risk.7 However, LBM dynamically decreases with advancing age, even when BMI remains stable. The incidence of coronary heart disease (CHD) is also well known to increase with age. Therefore, we hypothesised that the LBM index (LBMI) might be a better prognostic predictor of major adverse cardiovascular events (MACE) than conventional predictors, including BMI, in patients with CHD.
In the current study, we evaluated the relationship of body composition parameters, including BMI, LBMI and FM index (FMI), with adverse clinical events in an Asian population with CHD who had undergone percutaneous coronary interventions (PCIs).
Methods
Study populations
A retrospective subanalysis was performed using integrated data for the period August 2012 to July 2013 from the Shinshu Prospective Multicentre Analysis for Elderly Patients with Coronary Artery Disease Undergoing Percutaneous Coronary Intervention (SHINANO) registry. The SHINANO registry design has been described in detail previously.8 Briefly, this registry is a prospective, multicenter, observational registry of patients with any CHD, including stable angina, ST segment elevation myocardial infarction (STEMI), non-STEMI and unstable angina, who underwent PCI at one of 16 collaborating hospitals in the Nagano prefecture of Japan. This study was registered with the University Hospital Medical Information Network Clinical Trials Registry, as accepted by the International Committee of Medical Journal Editors (UMIN-ID; 000010070). The registry did not have any exclusion criteria, and was an all comer registry. The study protocol was developed in accordance with the Declaration of Helsinki and was approved by the ethics committee of each participating hospital. All patients gave written informed consent before participating.
Among the 1923 patients registered in the SHINANO registry, we identified 1857 patients who had body height and weight data recorded. Patients were prospectively followed for 1 year. The primary endpoint of this study was incidence of MACE, including all cause death, non-fatal myocardial infarction (MI) and ischaemic stroke. The relationship between the anthropometric measurements (BMI, FMI and LBMI) and the incidence of MACE was analysed.
Definitions
Body weight was measured using a digital scale to the nearest 0.01 kg, and height was measured to the nearest 0.1 cm using a stadiometer while patients stood without shoes. BMI was calculated as weight (kg) divided by height squared (m2). LBM was calculated using the James formula as follows: in men, LBM=(1.1×weight (kg))−(128×(weight (kg)/height (cm))2); in women, LBM=(1.07×weight (kg))−(148×(weight (kg)/height (cm))2).9 FM was calculated as LBM (kg) subtracted from body weight (kg). LBMI and FMI were calculated as LBM and FM (kg), divided by the height squared (m2).
Non-fatal MI was defined as a twofold or greater in increase in creatine phosphokinase concentration, troponin-T levels ≥0.1 ng/mL or new Q waves in ≥2 contiguous electrocardiogram leads.10 Ischaemic stroke was defined as the presence of a new neurological deficit, lasting for at least 24 h, with definite evidence of ischaemia on MRI or CT.11 Heart failure was based on a previous diagnosis, hospitalisation history or current heart failure treatment. Diabetes was defined as glycated haemoglobin (HbA1C) ≥6.5%, fasting plasma glucose ≥126 mg/dL or treatment with hypoglycaemic agents. Hypertension was defined as systolic blood pressure ≥140 mm Hg, diastolic blood pressure ≥90 mm Hg or ongoing therapy for hypertension. Dyslipidaemia was defined as a serum total cholesterol concentration ≥220 mg/dL, low density lipoprotein cholesterol (LDL-C) concentration ≥140 mg/dL or current lipid lowering therapy.12 Left ventricular ejection fraction (LVEF) was assessed by echocardiography using the Teichholz method, and LVEF ≤40% indicated left ventricular (LV) systolic dysfunction.13 All PCI procedures and selection of medical treatments after PCI were at the discretion of the treating physician.
Statistical analysis
Continuous variables are presented as mean±SD, if normally distributed, and as medians (IQR) if not normally distributed. Normality was assessed using the Shapiro–Wilk W test. Categorical variables are described as numbers and percentages. Clinical data were described and compared across the LBMI groups. Differences between the LBMI groups were analysed using the χ2 test for categorical variables and the Kruskal–Wallis test for continuous variables. The Kaplan–Meier test was performed to assess the cumulative incidence of MACE, stratified by BMI, LBMI and FMI tertiles. The log rank test was used to compare survival curves. Multivariate Cox regression analysis was performed to estimate the independent predictors of MACE; variables clinically associated with MACE were entered into the multivariate model. The variance inflation factor was used to evaluate multicollinearity for each variable; no variance inflation factor values were >2. All statistical analyses were performed using the Statistical Package for Social Sciences, V.21 (SPSS Inc, Chicago, Illinois, USA). A p value <0.05 was considered statistically significant.
Results
Baseline characteristics
Baseline characteristics for all patients and for the three LBMI groups are shown in table 1.
Baseline characteristics stratified by lean body mass index tertiles
Mean patient age was 70.6 years, 76.5% were men and mean BMI was 23.8 kg/m2 (range 13.4–40.8 kg/m2). Based on WHO definitions, 4.9% of subjects were obese (BMI ≥30.0 kg/m2), 28.1% were overweight (BMI 25.0–29.9 kg/m2), 61.8% were normal weight (BMI 18.5–24.9 kg/m2) and 5.2% were underweight (BMI <1.5 kg/m2). Among the traditional coronary risk factors, approximately 75% of patients had hypertension, 50% had dyslipidaemia, 40% had diabetes and 50% had a history of smoking. The group with low LBMI values (11.7–17.6 kg/m2) had a high proportion of patents who were older and/or were women. Patients in this group also were more likely to have LV dysfunction, atrial fibrillation, a history of stroke or peripheral artery disease (PAD) and acute coronary syndrome on admission. Concomitant atherosclerotic risk factors, including hypertension, dyslipidaemia, diabetes mellitus and smoking, were lower in patients with a low LBMI (11.7–17.6 kg/m2). The estimated glomerular filtration rate (eGFR) and serum haemoglobin levels were lower in patients with low LBMI values than in those with intermediate (17.7–19.1 kg/m2) or high (19.2–23.6 kg/m2) LBMI values.
To assess the strength of the relationship between LBMI and variables such as age, BMI, eGFR, LVEF, low density lipoprotein cholesterol levels and high density lipoprotein cholesterol levels, we performed multiple regression analysis using the backward stepwise method. The standardised regression coefficient values for age, BMI and high density lipoprotein cholesterol were −0.105, 0.834 and −0.086, respectively.
Incidence of major adverse cardiovascular events
Of 1857 patients, 1776 (95.6%) completed the 1 year follow-up. During the follow-up period, 161 cases (8.7%) of MACE occurred, including 91 all cause deaths, 42 non-fatal MIs and 28 ischaemic strokes. Figure 1 illustrates the cumulative incidence of MACE according to each BMI, FMI and LBMI tertile. The lower BMI and LBMI tertiles were more often associated with adverse clinical outcomes than the intermediate or higher tertiles (χ2 test for linear trend, p=0.003 and p<0.001, respectively). This trend was not present in the FMI tertiles. Figure 2 demonstrates the difference in each clinical event, according to LBMI tertile. The incidences of cardiac and non-cardiac deaths were significantly higher in patients with lower LBMI values than in those with intermediate or high LBMI values (χ2 for linear trend, p=0.023 and p<0.001, respectively). There were no significant differences in the incidences of ischaemic stroke and MI (χ2 for linear trend, p=0.251 and p=0.466, respectively).

Cumulative incidence of major adverse cardiovascular events (MACE) according to body mass index (BMI), fat mass index (FMI) and lean BMI (LBMI) tertiles. Patients with a BMI of 13.4–22.2 kg/m2 and a LBMI of 11.7–17.6 kg/m2 had a significantly higher incidence of MACE compared with patients having other BMI and LBMI values (χ2 test for linear trend p=0.003 and p<0.001, respectively).

Incidence of clinical events according to lean body mass index (LBMI) tertile. Patients with a LBMI of 11.7–17.6 kg/m2 had a significantly higher incidence of cardiac and non-cardiac deaths compared with those with intermediate or high LBMI values (χ2 test for linear trend p=0.023 and p<0.001, respectively). MI, myocardial infarction.
To assess the relationship between MACE and BMI, FMI and LBMI, we performed Kaplan–Meier analyses according to each anthropometric measurement. Patients with low BMI values (13.4–22.2 kg/m2) had a significantly higher incidence of MACE than those with intermediate (22.3–24.9 kg/m2) or high (25.0–40.8 kg/m2) BMI values (11.6% vs 6.6% vs 7.2%, log rank p=0.002). Patients with low LBMI values (11.7–17.6 kg/m2) also had a significantly higher incidence of MACE than those with intermediate (17.7–19.1 kg/m2) or high (19.2–23.6 kg/m2) LBMI values (12.9% vs 6.6% vs 5.8%, log rank p<0.001), as shown in figures 3 and 4. This trend was not observed in the Kaplan–Meier analysis of FMI (figure 5).

Kaplan–Meier analysis of major adverse cardiovascular events (MACE) stratified by lean body mass index (LBMI) tertile. Patients with a LBMI of 11.7–17.6 kg/m2 had a significantly higher incidence of MACE than those with intermediate (17.7–19.1 kg/m2) or high (19.2–23.6 kg/m2) LBMI values (12.9% vs 6.6% vs 5.8%, log rank p<0.001).

Kaplan–Meier analysis of major adverse cardiovascular events (MACE) stratified by body mass index (BMI) tertile. Patients with a BMI of 13.4–22.2 kg/m2 had a significantly higher incidence of MACE than those with intermediate (22.3–24.9 kg/m2) or high (25.0–40.8 kg/m2) BMI values (11.6% vs 6.6% vs 7.2%, log rank p=0.002).

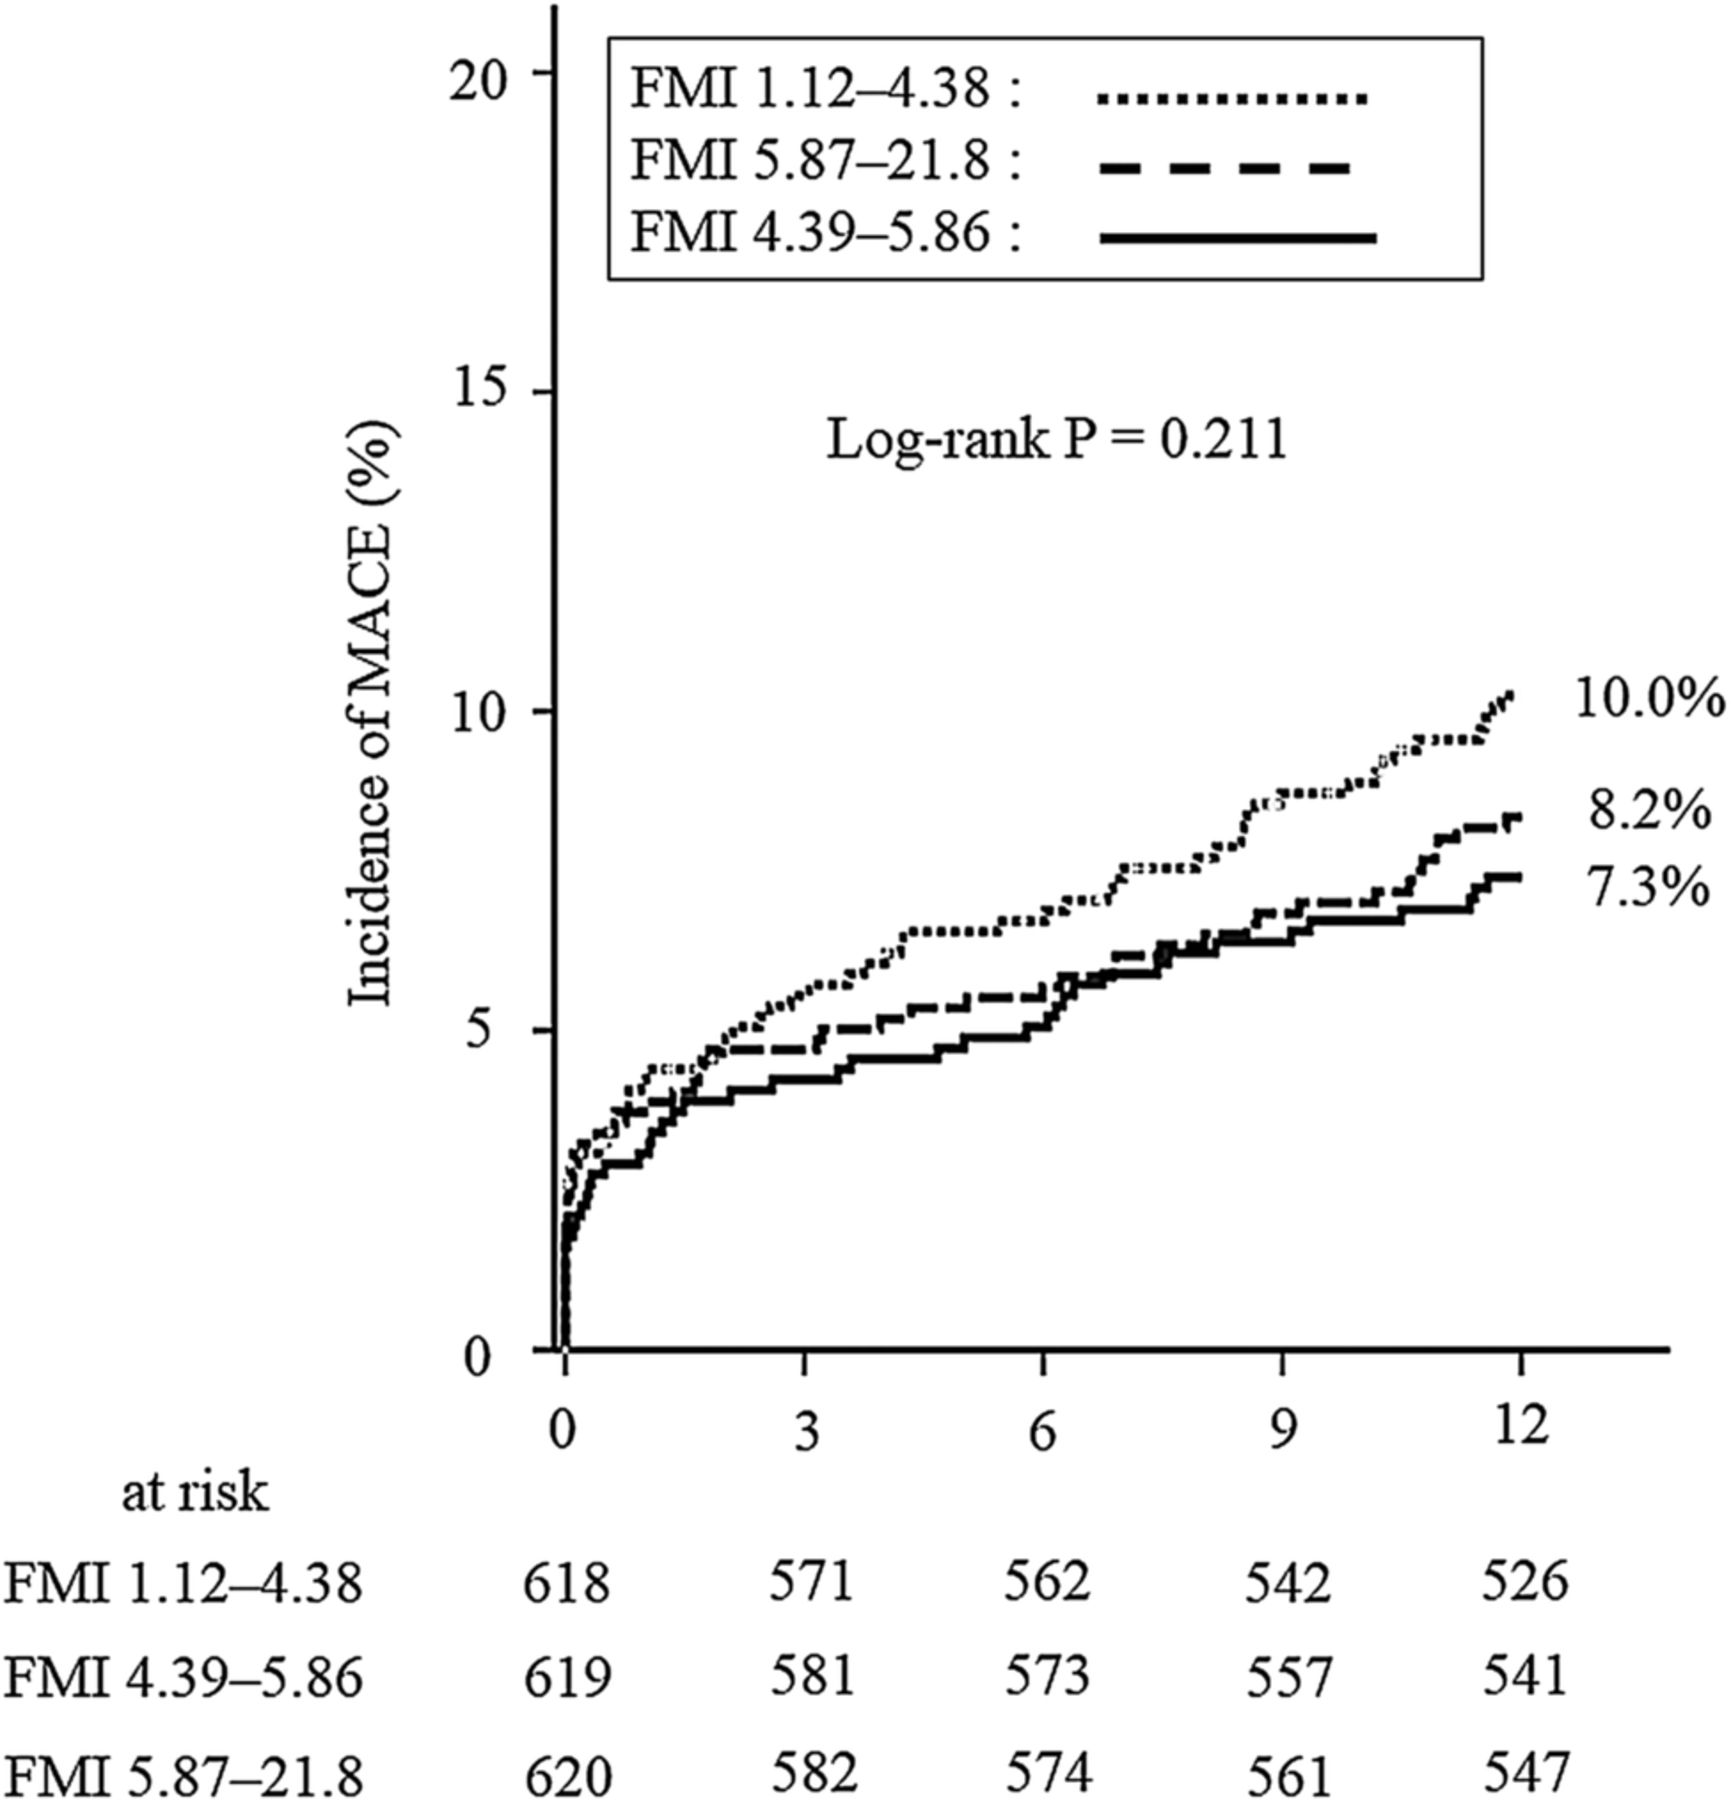
Kaplan–Meier analysis of major adverse cardiovascular events (MACE) stratified by fat mass index (FMI) tertile. There were no significant differences in MACE across patients with low (1.12–4.38 kg/m2), intermediate (4.39–5.86 kg/m2) or high (5.87–21.8 kg/m2) FMI values (10.0% vs 7.3% vs 8.2%, log rank p=0.211).
Multivariate Cox regression analysis was performed to identify the specific predictors of MACE in the study population. After adjusting for age, sex, eGFR, LV systolic dysfunction, a history of cerebral infarction or PAD, atrial fibrillation, hypertension, dyslipidaemia, diabetes mellitus and acute coronary syndrome, a low LBMI (11.7–17.6 kg/m2) was an independent predictor of MACE (HR 1.51; 95% CI 1.01 to 2.24; p=0.043). In the same multivariate models, a low BMI (13.4–22.2 kg/m2) was not associated with MACE (HR 1.37; 95% CI 0.97 to 1.95; p=0.075) (table 2).
Univariate and multivariate analyses of MACE in the overall study population
Clinical validation of LBMI in patients with a normal BMI
In the current study, more than half (61.8%) of patients had a normal BMI (18.5–24.9 kg/m2). To assess the clinical validation of LBMI in patients with a normal BMI, we performed Kaplan–Meier analysis according to MACE stratified by LBMI tertile (11.7–17.6 kg/m2, 17.7–19.1 kg/m2 and 19.2–23.6 kg/m2). In the subgroup of patients with a normal BMI, patients with a low LBMI (11.7–17.6 kg/m2) had a significantly higher incidence of MACE than those with an intermediate (17.7–19.1 kg/m2) or high (19.2–23.6 kg/m2) LBMI (12.6% vs 5.6% vs 3.4%, log rank p<0.001), as shown in figure 6.

Kaplan–Meier analysis according to major adverse cardiovascular events (MACE) stratified by lean body mass index (LBMI) tertile in patients with a normal body mass index. Patients with a low LBMI (11.7–17.6 kg/m2) had a significantly higher incidence of MACE than those with intermediate (17.7–19.1 kg/m2) or high (19.2–23.6 kg/m2) LBMI values (12.6% vs 5.6% vs 3.4%, log rank p<0.001).
Discussion
In the current study, we demonstrated that a low LBMI could predict MACE in patients with CHD who had undergone PCI. In particular, patients with a LBMI of 11.7–17.6 kg/m2 had a higher incidence of MACE than those with an intermediate (17.7–19.1 kg/m2) or high (19.2–23.6 kg/m2) LBMI. Patients with a BMI of 13.4–22.2 kg/m2 also had a higher incidence of MACE; however, a BMI within this range was not an independent predictor of MACE in multivariate Cox regression analysis. Our results indicate that the assessment of LBMI provides further insight into risk stratification, following revascularisation, in patients with CHD compared with risk stratification using only BMI.
BMI is the most frequently reported tool for determining under/overweight and obesity, and a relationship between BMI and CHD patient prognosis has been established.14 Nevertheless, BMI has also been reported to be poor in distinguishing body fat from LBM.15 A recent study showed that estimation of body fat using BMI underestimated or overestimated true body fat in nearly half of patients with CHD.16 The relationship between BMI and mortality is especially variable in elderly patients;17 furthermore, BMI does not account for patient sex.18 Previous studies have also reported an increased cardiovascular risk in patients with normal weight obesity, defined as patients with a normal BMI in conjunction with elevated adiposity.19 Similarly, the waist to hip ratio has been demonstrated as a useful predictor of mortality and cardiovascular disease in Caucasian populations.20 However, neither waist circumference nor waist to hip ratio was associated with mortality in Asian populations.21
Assessment of body shape may not always contribute to adverse event prediction in all races. During the past decade, the impact of body fat and LBM on mortality has been assessed to identify body composition parameters that are more effective for predicting mortality. Navaneethan et al22 reported that a higher LBM, which was measured using dual energy X-ray absorptiometry, was associated with lower mortality in patients without chronic kidney disease. Lavie et al23 demonstrated that lean mass index and body fat, measured using skinfold methods, predicted mortality in patients with stable CHD. They also showed that higher fat levels are associated with a better prognosis in CHD.24 However, previous studies have not reported that LBMI is useful in predicting mortality in patients with CHD, including those with stable angina, unstable angina, STEMI and non-STEMI.
We observed a relationship between LBMI and MACE in patients undergoing PCI, whereas BMI and FMI were not individually associated with MACE, in this population. This result is consistent with previous reports describing body composition and survival in patients with stable CHD.25 Thus evaluating LBMI, rather than BMI, may be important for risk stratification in patients with CHD. In this study, the mean BMI value was 23.8±3.5 kg/m2, which is similar to previous research studies in Asian populations;21 therefore, our results may be representative of the general population. An analysis of patients with normal BMI values, which accounted for more than half of the study population, showed that a low LBMI was also associated with poor clinical outcomes compared with intermediate or high LBMI values. Thus stratification using LBMI, in patients with normal BMIs, may be more useful for predicting clinical outcomes.
Although concomitant atherosclerotic risk factors were fewer in patients with a lower LBMI, the number of patients with a prior history of stroke or PAD was higher in these patients than in those with a higher BMI. In a recent study, Huang et al26 showed that low LBMI values predicted mortality in an Asian population with CAD. Similar to the result of Huang et al, our results demonstrated that a lower LBMI was an independent predictor of adverse events, after adjusting for concomitant atherosclerotic risk factors and atherosclerotic disease. A lower LBMI may be a risk factor for atherosclerotic disease although this putative relationship requires further evaluation in larger numbers of patients.
A non-significant association has been reported between BMI and mortality in elderly patients (≥65 years), and the relationship between BMI and mortality in elderly patients has been demonstrated to be represented by a U-shaped curve with a large flat bottom.27 In our population, the proportion of patients ≥65 years of age was high (72.3%), and only 4.9% of patients had a BMI ≥30 kg/m2.
LBMI is clinically beneficial for detecting patients with sarcopenia, defined as an age related decline in LBM and muscle strength.28 This condition has been reported to be associated with muscle loss, obesity and insulin resistance because of increased visceral fat, which promotes cardiovascular disease29 and a high incidence of mortality.30 In the assessment of standardised regression coefficients, LBMI was not strongly dependent on age, which demonstrated significant differences between LBMI tertiles. Therefore, measurement of LBMI provides additional prognostic value to the risk stratification.
Limitations
In the current study, LBM was calculated using the James formula, rather than being assessed using resistance measurement or dual energy X-ray absorptiometry. However, the James formula has been reported to perform satisfactorily in normal and moderately obese patients. In the study population, the proportion of patients with a BMI ≥30 kg/m2 was only 4.9%. Therefore, our results were not affected by the LBM measurement. Only patients diagnosed with CAD were included in this study; our results may not apply to the normal population. An assessment of the prognostic value of the LBMI in the general population is warranted.
Conclusion
The current study demonstrated that stratification using LBMI may help to predict adverse events in patients with CHD who have undergone PCI. Further long term and multiracial studies in larger populations are needed to assess the clinical validation of LBMI with regard to long term outcomes and in the general population.
Key messages
What is already known about this subject?
The association between body mass index (BMI) and prognosis has been studied in patients with coronary artery disease. However, age, gender and race were reported to alter this association. Body mass is composed of fat body mass and lean body mass. Lean body mass was reported to be inversely associated with mortality in Caucasian populations.
What does this study add?
A low lean BMI (LBMI) was an independent predictor of major adverse cardiovascular events (MACE) in an Asian population who underwent percutaneous coronary intervention for coronary artery disease. In a subgroup of patients with a normal BMI, this result was preserved. BMI alone did not predict the poor clinical outcomes in this population.
How might this impact on clinical practice?
Stratification using LBMI helped to predict adverse events in patients with coronary artery disease who underwent percutaneous coronary intervention. It might be more beneficial to use LBMI for stratifying risk in patients with a normal BMI.
Acknowledgments
The authors thank the SHINANO registry investigators: Shoji Hotta, Ina Central Hospital, Ina, Japan; Yuichi Kamiyoshi, Nagano Municipal Hospital, Nagano, Japan; Takuya Maruyama, Shinonoi General Hospital, Nagano, Japan; Noboru Watanabe, Hokushin General Hospital, Nakano, Japan; Takayuki Eisawa, Komoro Kosei General Hospital, Komoro, Japan; Shinichi Aso, Aizawa Hospital, Matsumoto, Japan; Shinichirou Uchikawa, Azumino Red Cross Hospital, Azumino, Japan; Naoto Hashizume, Shinshu University School of Medicine, Matsumoto, Japan; Noriyuki Sekimura, Matsumoto Medical Centre, Matsumoto, Japan; Takehiro Morita, Nagano Matsushiro General Hospital, Nagano, Japan.
References
Footnotes
Collaborators Shoji Hotta, Yuichi Kamiyoshi, Takuya Maruyama, Noboru Watanabe, Takayuki Eisawa, Shinichi Aso, Shinichirou Uchikawa, Naoto Hashizume, Noriyuki Sekimura and Takehiro Morita.
Contributors HKo, MK, HN, HKi, EM, HA and TS participated in the acquisition of the data at each participating hospital. HH, TM, SE and YM were responsible for the conception and design of the study. HM and UI drafted the manuscript.
Competing interests None declared.
Ethics approval This study was approved by the ethics committee of each participating hospital.
Provenance and peer review Not commissioned; externally peer reviewed.