Article Text

Abstract
Objective The prognostic importance of changes in ischaemic ECG abnormalities over time (especially ST-T abnormalities) among Asians has not been fully investigated. We examined the associations between changes in ischaemic abnormalities upon serial ECG (improvement, persistence, deterioration) and cardiovascular disease (CVD) risk.
Methods A prospective study cohort was conducted with 9374 men and women aged 40–69 years in four communities. Participants had multiple ECGs at study entry and during the next 10 years, and were followed up for a median period of 23.0 years. Total CVD (stroke and coronary heart disease) was ascertained under systematic surveillance. ECG abnormalities were defined by the Minnesota Code, ST depression (Code4), abnormal T wave (Code5) and categorised into nine groups (no–no, no–minor, no–major, minor–no, minor–minor, minor–major, major–no, major–minor, major–major) by comparison with the point of entrance and maximum change.
Results We documented 1196 CVD events. Compared with no–no abnormality, no–minor, minor–major and major–major in Code4, HRs (95% CI) adjusted for cardiovascular risk factors were 1.19 (1.00–1.42), 1.57 (1.15–2.12) and 1.87 (1.42–2.47). Similar results were observed in Code5.
Conclusions Changes in ischaemic ECG abnormalities from none to minor, and minor to major, as well as persistent major abnormalities, were associated with an increased risk of CVD.
This is an Open Access article distributed in accordance with the Creative Commons Attribution Non Commercial (CC BY-NC 4.0) license, which permits others to distribute, remix, adapt, build upon this work non-commercially, and license their derivative works on different terms, provided the original work is properly cited and the use is non-commercial. See: http://creativecommons.org/licenses/by-nc/4.0/
Statistics from Altmetric.com
Introduction
The most common findings of ischaemic ECG are ST-segment or T-wave abnormalities, or both (‘ST-T abnormalities’).1 Prospective studies have shown that these abnormalities are associated with an increased risk of cardiovascular disease (CVD).1–6 We investigated the relationship between non-specific minor or major ST-T abnormalities and the prevalence of stroke among Japanese men.2 Those studies examined a single ECG abnormality as a predictor of CVD.
However, we believe that changes in ECG abnormalities over time should be explored because a single ECG measurement may not be sufficient to estimate long-term ischaemic abnormalities. Therefore, we focused on changes in ST-T abnormalities (ie, persistent or worsening changes in ischaemic ECG abnormalities). Previous cohort studies from the Europe and the USA that have collected repeat ECGs showed that persistent and new ECG abnormalities were associated with an increased risk of CVD.3 ,4
We hypothesise that worsening changes in ST-T abnormalities may be associated strongly with CVD risk. Thus, we aimed to ascertain if changes in ECG abnormalities in annual examinations for 11 years were associated with a subsequent risk of CVD in a general population in Japan within the Circulatory Risk in Communities Study (CIRCS).
Methods
Study population
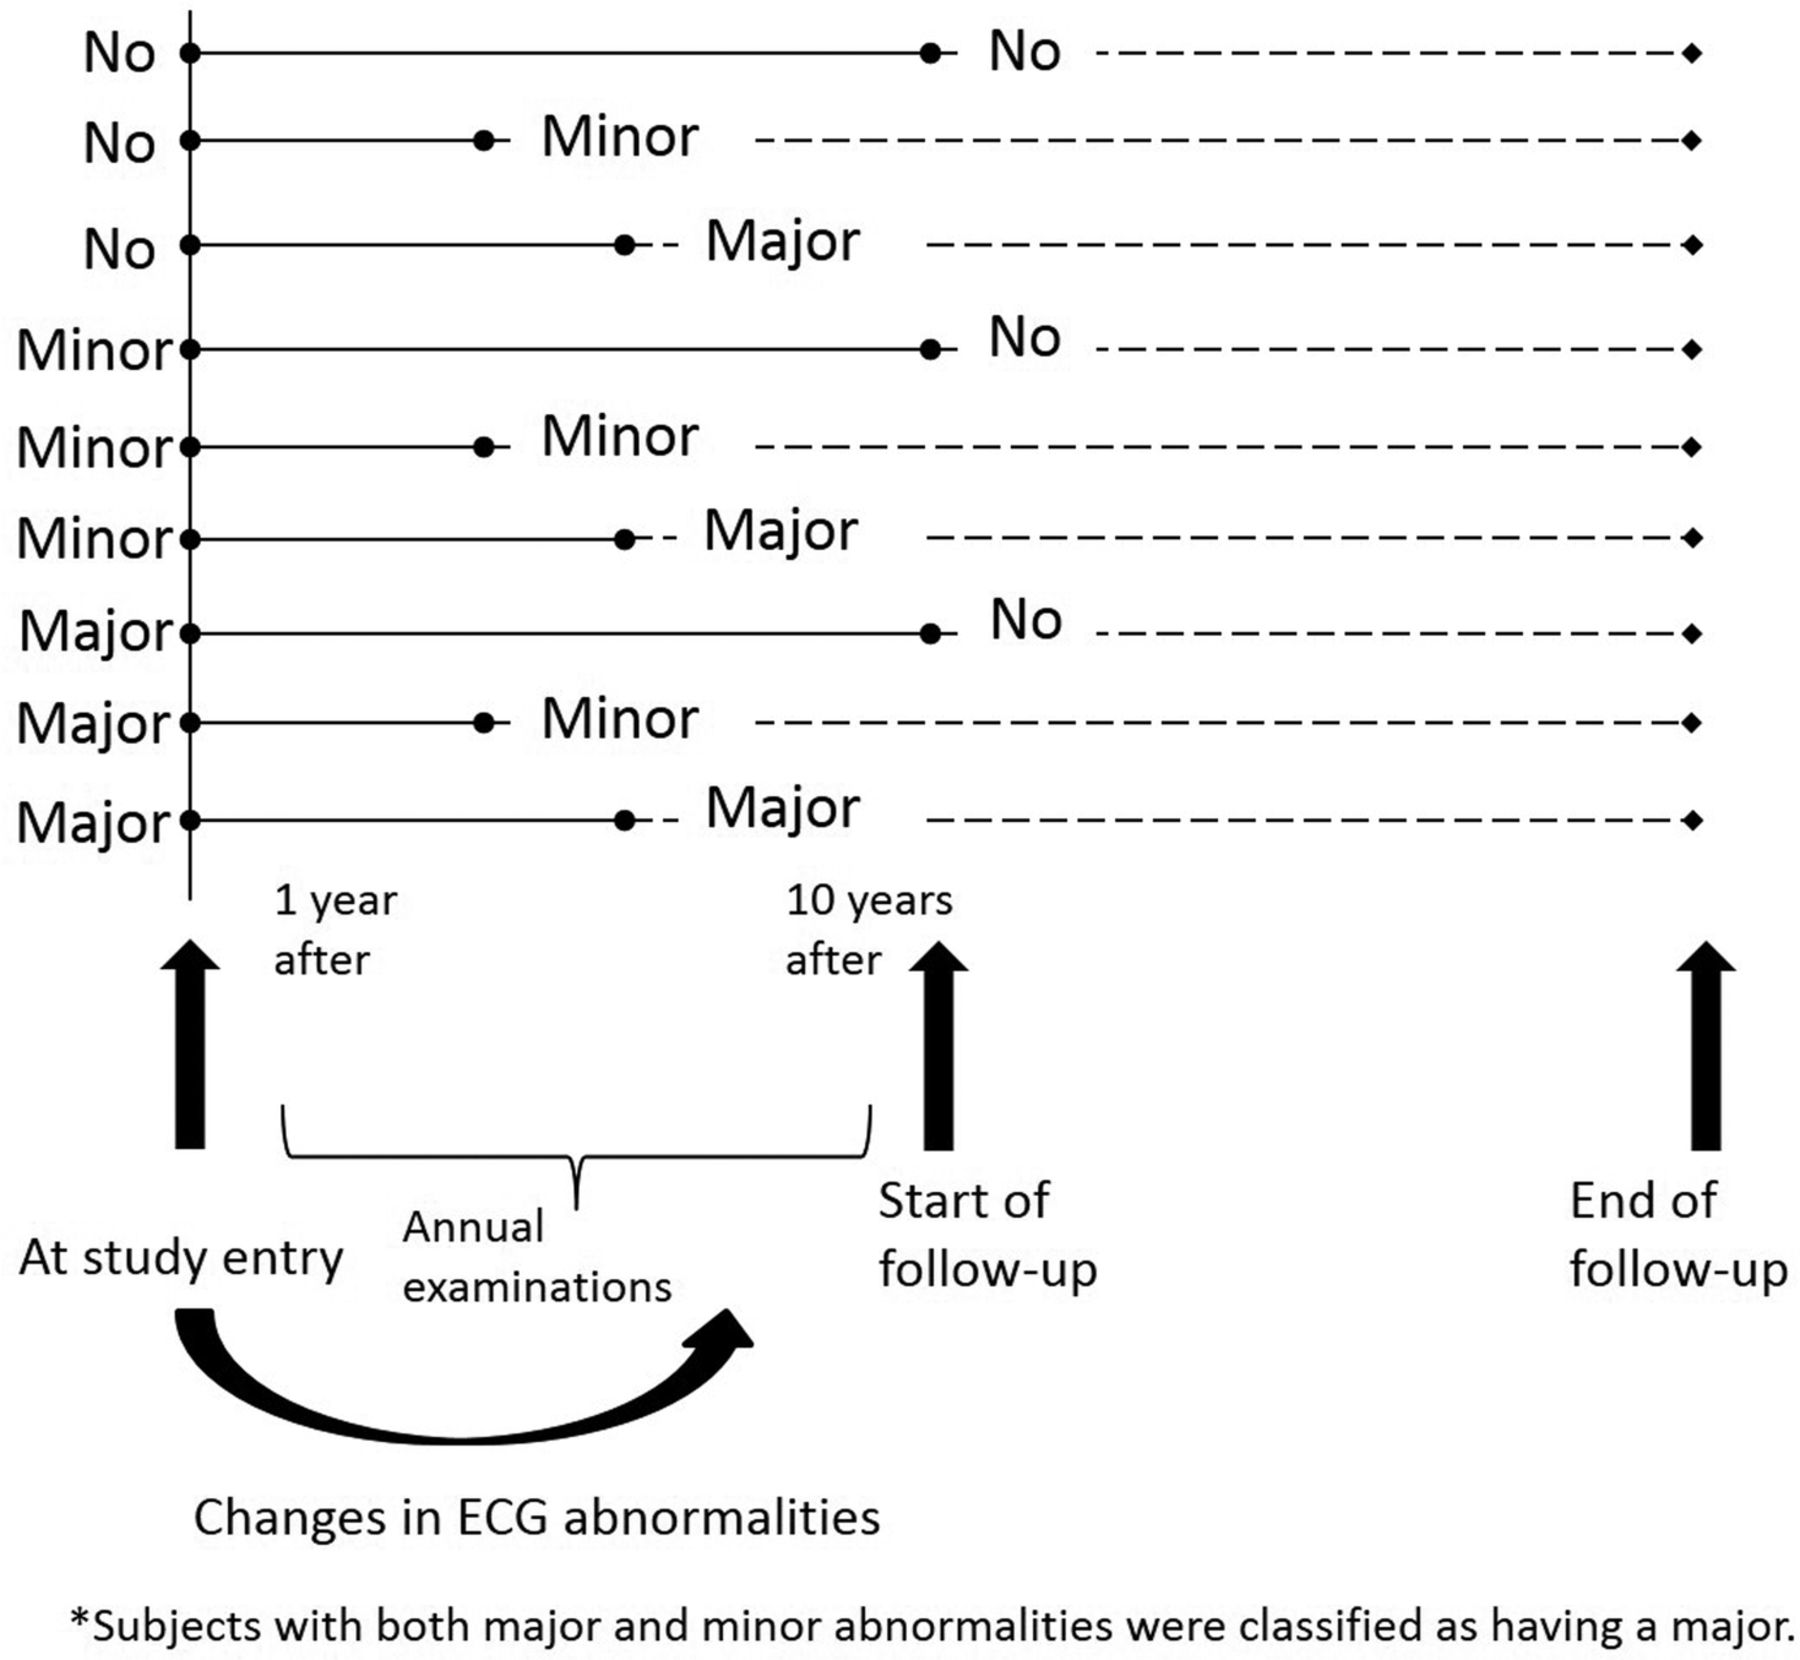
The CIRCS is a population-based cohort study of cardiovascular risk factors and CVD incidence in Japanese populations. Details of the design and methods of the study are described elsewhere.2 ,7 Briefly, subjects were Japanese residents living in rural or suburban communities from 1975 to 1987: the town of Ikawa, Noichi and Kyowa; the city of Yao. Participants underwent an extensive examination (including 12-lead ECG at rest) at study entry that was repeated annually for the next decade. The present study used data from the first 11 ECG examinations (ie, at study entry and first 10 annual re-examinations) (figure 1). The target population of the present study was 11 611 men and women aged 40–69 years at study entry (figure 2). We excluded persons with missing data for ECG, body mass index (BMI) and blood pressure (BP) and subjects with a history of CVD at study entry (n=517). We also excluded 38 participants with baseline ECG abnormalities that included abnormal Q and QS patterns because these codes were regarded as having ‘old’ myocardial infarction.1 During the 10 subsequent annual examinations, 1621 persons had no second ECG and 61 persons had CVD events or moved from the area before the 10th annual examination, so we excluded them from analyses. The remaining 9374 participants constituted the study cohort.

Changes in ECG abnormalities.

Flow chart showing the number of participants at each phase. BMI, body mass index; CVD, cardiovascular disease.
ECG measurements at study entry
Standard 12-lead ECG at rest was recorded in the supine position. Each record was coded independently according to the Minnesota Code by two trained physicians.8 Agreement for classification of the Minnesota Code was accepted, and disagreements were discussed between the two physicians until a consensus was reached.
We handled ST-segment abnormalities (Code4) and T-wave abnormalities (Code5) of the Minnesota Code, which are indices of ischaemia.1 The agreement for ECG abnormalities in Code4 and Code5 was estimated by calculation of the kappa coefficient. The 4-1 and 4-2 of Code4 were defined as a ‘major abnormality’; 4-3, 4-4 and modified 4-5 of Code4 were defined as a ‘minor abnormality’; 5-1 and 5-2 of Code5 were defined as a major abnormality; 5-3, 5-4 and modified 5-5 of Code5 were defined as a minor abnormality.2 ,8 Subjects with both major and minor abnormalities were classified as having a major.
ECG measurements during annual examinations
Serial ECGs at study entry and during annual examinations of the same person were used to examine changes in ECG abnormalities, categorised according to comparison with that at study entry and the point of maximum change during the subsequent 10 annual examinations. With respect to Code4 and Code5, participants were classified into nine groups: changing from no abnormalities at study entry to no abnormalities later (no–no abnormality); from no to minor (no–minor abnormality); from no to major (no–major abnormality); from minor to none (minor–no abnormality); from minor to minor (minor–minor abnormality); from minor to major (minor–major abnormality); from major to none (major–no abnormality); from major to minor (major–minor abnormality) and from major to major (major–major abnormality).
The individual follow-up time was censored if a major abnormality occurred first (figure 1). If there was no major abnormality during the 10 annual examinations, the follow-up time was censored if a minor abnormality occurred first. If there was no minor abnormality before the 10th annual re-examination, the follow-up time was censored if the final ECG was done.
Endpoint determination
The details of endpoint determination have been described elsewhere.2 ,7 For all residents, CVD events were ascertained by five overlapping methods: reports by public-health nurses and health volunteers; annual surveys of cardiovascular risk; national insurance claims; reports by local physicians and death certificates. To confirm the diagnosis, all living patients were telephoned and/or visited to obtain their medical histories in addition to reviews of their medical records in hospitals and local clinics. In cases of deaths with underlying causes of stroke or coronary heart disease (CHD), we obtained medical histories and/or reviewed medical records. The primary focus of our study was on associations of changing status of ST-T abnormalities with the risk of CVD events, but the results for stroke and CHD are presented separately.
Criteria for incident stroke were defined as a focal neurological deficit of rapid onset and lasting ≥24 hours or until death.2 ,7 The determination of stroke subtypes was done primarily by using findings of CT/MRI, which were available for 81.6% of stroke cases. Stroke subtypes were defined as ‘intracerebral haemorrhage’, ‘subarachnoid haemorrhage’, ‘ischaemic stroke’ and ‘unclassified stroke’. Strokes were diagnosed clinically but that did not show a lesion on imaging were classified according to clinical criteria. Criteria for incident CHD (ie, definite sudden cardiac death <1 hour of onset, definite angina pectoris, definite and probable myocardial infarction) have been described.7 The final diagnosis for the CVD endpoint was made by physicians and epidemiologists blinded to survey data of cardiovascular risk factors.
Follow-up lasted until the end of 2010 for Ikawa, Kyowa and Yao, and until the end of 2007 for Noichi. During subsequent follow-up, 593 persons moved out of the community and 3694 died, and they were censored at the date of moving out of the community or the date of death, respectively.
Statistical analysis
Values are the mean±SD or percentages, as appropriate. Analyses of covariance were used to test differences in age-adjusted and gender-adjusted means and proportions of characteristics at study entry according to the categories of ECG abnormalities set out in Code4 and Code5. HRs and 95% CIs of CVD prevalence were calculated with reference to the HR of persons without ECG abnormalities using a Cox proportional hazards regression model adjusted for risk factors for CVD. Covariates were these factors: age and gender for model 1; model 1 plus systolic BP, antihypertensive medication, BMI, smoking category (never, past or daily), category of alcohol intake (never, past, current <46 or current ≥46 g/day), serum levels of total cholesterol9 and diabetic type for model 2; model 2 plus other ECG abnormalities at study entry, high R-wave (Minnesota Code 3-1),8 ,10 ventricular premature beats (Minnesota Code 8-1-2)8 ,11 and atrial fibrillation (Minnesota Code 8-3-1)8 ,12 that were associated with CVD risk in our study for model 3; model 3 plus identical ECG abnormalities during subsequent annual 10 years examinations for model 4. ‘Diabetic type’ was defined as a fasting glucose level of ≥126 mg/dL and/or a non-fasting glucose level of ≥200 mg/dL, and/or current use of medication for the treatment of diabetes mellitus. Person-years were calculated as the sum of individual follow-up time until CVD, emigration, death or the end of follow-up. If participants suffered a stroke, sudden cardiac death, angina pectoris or myocardial infarction, the shortest person-years was adopted. Subjects who had moved away from the community or died were treated as censored cases. Statistical analyses were done with SAS V.9.4. and p<0.05 (two-tailed) was considered significant.
Results
ECG abnormalities at study entry
Characteristics of participants are shown in table 1. Of the 11 056 persons (4417 men and 6639 women) at study entry, mean (SD) of age was 52.9 (8.7) years. Mean values of age, BMI, systolic BP, diastolic BP, alcohol intake, serum levels of total cholesterol, proportion of use of antihypertensive medication and diabetic type were progressively and gradually higher according to ECG worsening, from none, minor to major abnormalities.
Mean (SD) values of risk characteristics at study entry
During a follow-up of 25.5 years, 1468 CVDs were documented. Persons with ECG abnormalities at study entry had a higher age-adjusted and gender-adjusted HR of total CVD than did those without ECG abnormalities (table 2). The multivariable HR (95% CI) of total CVD adjusted for cardiovascular risk factors (model 2) was 1.21 (1.03–1.42) for a Code4 minor abnormality and 1.69 (1.36–2.10) for a Code4 major abnormality. Regarding Code5, the corresponding multivariable HR of total CVD (model 2) was 1.25 (1.06–1.46) and 2.16 (1.72–2.70). After further adjustment for other ECG abnormalities at study entry (model 3), the results did not change materially. A moderate association was found between Code4 and Code5 abnormalities at study entry. The proportion of cases having both Code4 and Code5 abnormalities was 6.0% (n=667) and the kappa coefficient for the agreement of these abnormalities was 0.41. The multivariable HR (95% CI) of total CVD for having both Code4 and Code5 abnormalities (model 2) was 1.71 (1.44–2.03), whereas the corresponding HR of having only a Code4 abnormality was 1.00 (0.82–1.23) and the corresponding HR of having only a Code5 abnormality was 1.13 (0.92–1.39) (data not shown).
HRs and 95% CIs of cardiovascular disease (CVD) for ECG abnormalities in Code4 and 5 at study entry
Women with minor abnormalities in Code4 and Code5 were not associated with subsequent CVD risk (see online supplementary table S1). In women, the multivariable HR (95% CI) of total CVD (model 2) was 0.94 (0.76–1.17) for a Code4 minor abnormality and 1.09 (0.88–1.34) for a Code5 minor abnormality. Results of total CVD were similar between men and women for the other men or women groups.
supplementary tables
Changes in ECG abnormalities
During a follow-up of 23.0 years, out of 9374 participants (3545 men and 5829 women), 1196 CVDs were documented. The median observation time for patterns of changes of ECG abnormalities before commencing follow-up was 2.0–5.2 years (see online supplementary table S2).
Table 3 shows the HR (95% CI) of CVD for each pattern of changes in abnormalities in Code4 compared with the pattern of no–no ECG abnormality as shown in models 1–4. Regarding Code4, patterns of no–minor, minor–major and major–major abnormalities had the higher multivariable HR of CVD. The corresponding multivariable HR (95% CI) of total CVD for Code4 was 1.19 (1.00–1.42), 1.57 (1.15–2.12) and 1.87 (1.42–2.47) in model 2. Other patterns except for no–minor, minor–major and major–major abnormalities had no significant association between changes in ECG abnormality and risk of total CVD. In men, the corresponding multivariable HR (95% CI) was 1.48 (1.11–1.97), 2.35 (1.48–3.74) and 3.02 (2.00–4.56), and in women, the corresponding multivariable HR (95% CI) was 1.08 (0.86–1.34), 1.21 (0.81–1.81) and 1.34 (0.91–1.96) (data not shown). With regard to the impact of other ECG abnormalities, the multivariable HR (95% CI) of total CVD was 1.27 (1.12–1.44) for high R-wave, 1.90 (1.27–2.86) for ventricular premature beats and 2.80 (1.88–4.16) for atrial fibrillation. For further adjustment in models 3 and 4, the multivariable HR of total CVD was attenuated, but results for statistical significance did not change materially. Table 4 shows the HR (95% CI) of CVD for each pattern of changes in abnormalities in Code5. The multivariable HR of CVD in patterns of no–minor, minor–major and major–major abnormalities in Code5 was 1.42 (1.19–1.69), 1.95 (1.46–2.61) and 2.56 (1.95–3.36) in model 2. In men, the corresponding multivariable HR (95% CI) was 1.62 (1.23–2.12), 2.39 (1.53–3.74) and 3.26 (2.10–5.04), and in women, the corresponding multivariable HR (95% CI) was 1.32 (1.06–1.66), 1.69 (1.15–2.48) and 2.19 (1.53–3.12) (data not shown). For further adjustment in models 3 and 4, the multivariable HR of total CVD did not change materially.
HRs and 95% CIs of cardiovascular disease (CVD) according to changes in ECG abnormalities in Code4
HRs and 95% CIs of cardiovascular disease (CVD) according to changes in ECG abnormalities in Code5
The multivariable HR of stroke showed similar results to those of total CVD. The multivariable HR of CHD was significant only for a major–major ECG abnormality compared with a no–no abnormality.
Discussion
Worsening changes in ischaemic ECG abnormalities were associated with an increased risk of total CVD by 19% for a new minor abnormality in Code4; 57% for changing to a major abnormality from a minor abnormality in Code4; 42% for a new minor abnormality in Code5 and 95% for changing to a major abnormality from a minor abnormality in Code5. Persistent major abnormalities at a particularly high risk of CVD events were found to increase by 87% in Code4 and by 156% in Code5.
A cohort study of 1221 Swedish men with a follow-up of 32 years collected repeat ECGs at 50 and 70 years of age and reported that a new depression of the ST segment (Minnesota Code 4-1 and 4-2) and a new T-wave abnormality (Minnesota Code 5-1, 5-2 and 5-3) were associated with a twofold to threefold increased risk of CVD mortality.3 In that study, persistent ST-T abnormalities were associated with a fivefold to sixfold increased risk of CVD mortality (albeit with a small number of CVD deaths). An 8-year follow-up study of 2192 US citizens aged 70–79 years that collected repeat ECGs at baseline and 4 years after showed that new ECG abnormalities (either of Minnesota Code 1-1 to 1-2-8, 3-1, 4-1 to 4-4, 5-1 to 5-4, 6-4-1, 6-4-2, 7-1-1, 7-2-1, 7-4, 7-8 or 8-3) were associated with a twofold increased risk of subsequent CHD events.4 In that study, persistent abnormalities were associated with a 1.5-fold increased risk of CHD.
The present study had three key findings. First, abnormality groups that changed from none to minor during 11-year annual surveys were associated with CVD risk. Second, even for a minor abnormality, if it worsens over time, then it should be considered to be a clinically significant finding for a high-risk individual. Third, persistent major abnormalities on repeat ECGs carried a higher risk of CVD than new major abnormalities.
It is noteworthy that we observed weak and non-significant associations between ST-T abnormality changes from none to major and risk of CVD after adjustment for known cardiovascular risk factors. These associations were attenuated substantially when systolic BP and antihypertensive medication were taken into account, which means that hypertension mainly confounded the association.
Our study showed differences between men and women for the association between ischaemic ECG abnormalities and CVD risk. The association between changes in a Code4 abnormality and CVD risk was confined to men. Absence of such an association in women may be a result of the higher prevalence of a minor Code4 abnormality.2 In the present study, the prevalence of a Code4 abnormality was twofold higher in women than in men. It is well known that women are more likely to have minor ST-T abnormalities as a normal physiological variant.
Confounding by other ECG abnormalities should be considered. High R-wave, ventricular premature beats and atrial fibrillation at study entry were associated with an increased risk of total CVD, as shown previously.10–12 When we adjusted further for these ECG abnormalities at study entry and during 10 annual examinations, the result for total CVD did not change.
The potential mechanism of action for the association between the presence, appearance or advancement of ST-T abnormalities and CVD risk warrants discussion. ST-T abnormalities are caused by myocardial ischaemia, hypokalaemia and certain drugs,13 but the most common cause in a general population is slight-to-moderate myocardial ischaemia. Usually, myocardial ischaemia is caused by atherosclerosis and/or arteriolosclerosis in coronary arteries, and also accompanied by these pathological changes in other vascular systems (ie, atherosclerosis in large cerebral arteries and arteriolosclerosis in small cerebral arteries).14 ,15 Therefore, ST-T changes should be a surrogate marker for disease in large and small vessels, which lead to an increased risk of stroke and CHD.
The strength of the present study, compared with previous studies,3 ,4 was the long follow-up of a large population of men and women in whom repeat ECGs were available during 11 years. The limitation of our study was the small number of CVD events in the major–no and major–minor abnormality groups, in which the relationship between the ECG abnormality and CVD risk was not examined thoroughly.
Conclusion
Changes in ischaemic ECG abnormalities from none to minor, and minor to major, as well as persistent major abnormalities, are associated with an increased risk of CVD in a general population.
Key messages
What is already known about this subject?
ST-T abnormalities in ECG at study entry are associated with an increased risk of cardiovascular disease (CVD) among Europeans and Americans.
What does this study add?
Changes in ischaemic ECG abnormalities from none to minor, and minor to major, as well as persistent major abnormalities, are associated with an increased risk of CVD among Asians.
How might this impact on clinical practice?
Repeated measurements of annual ECGs are useful for more precise prediction of CVD.
Acknowledgments
The authors thank Professor Emeritus Yoshio Komachi (University of Tsukuba), Professor Emeritus Hideki Ozawa (Oita Medical University), Former professor Minoru Iida (Kansai University of Welfare Sciences), Professor Emeritus Takashi Shimamoto (University of Tsukuba), Dr Yoshinori Ishikawa (Consultant of Osaka Center for Cancer and Cardiovascular Disease Prevention), Professor Yoshihiko Naito (Mukogawa Women's University) and Professor Tomonori Okamura (Keio University) for their support in conducting long-term cohort studies. The authors also thank the clinical laboratory technologists, public health nurses, engineers of the computer processing unit, nurses and nutritionists in the Osaka Center for Cancer and Cardiovascular Disease Prevention and health professionals in the survey communities for their valuable assistance for their expert help.
References
Footnotes
Collaborators The CIRCS Investigators are TO, IM, MH-T, Shinichi Sato, YS and MK, Osaka Center for Cancer and Cardiovascular Disease Prevention; AK (present address; Tokyo Metropolitan Institute of Gerontology), HI, RC and HI, Osaka University; KY and TS, University of Tsukuba; Isao Koyama and Masakazu Nakamura, National Cerebral and Cardiovascular Center; Masanori Nagao and MU, Dokkyo Medical University School of Medicine; TO, Fukushima Medical University; Isao Saito, Ehime University and Ai Ikeda, Koutatsu Maruyama and Takeshi Tanigawa, Juntendo University.
Contributors TS, HI, IM, HI: conception and design. TS, HI, IM, MH-T, YS, RC, AK, MK, TO, TO, KY, MU, TS and HI: acquisition of data. TS, HI and HI: analysis and interpretation of data. TS: drafting of the manuscript. HI, IM, MH-T, YS, RC, AK, MK, TO, TO, KY, MU, TS and HI: revising the manuscript critically for important intellectual content. TS, HI, IM, MH-T, YS, RC, AK, MK, TO, TO, KY, MU, TS and HI: approval of the version of the manuscript to be published.
Competing interests None declared.
Patient consent Obtained.
Ethics approval Osaka Center for Cancer and Cardiovascular Disease Prevention and Osaka University.
Provenance and peer review Not commissioned; peer reviewed externally.