Article Text

Abstract
Objectives To determine the autonomic cardiovascular control among residents of Hawaii who are exposed to varying levels of volcanic air pollution (vog), which consists largely of sulfur dioxide (SO2) and acid aerosols.
Methods In a cross-sectional study between April 2006 and June 2008, the authors measured cardiovagal autonomic function by heart-rate variability (HRV) in 72 healthy individuals who lived in four exposure zones on Hawaii Island: vog-free (n=18); episodic exposure to SO2 >200 ppb and acid aerosol (n=19); chronic exposure to SO2 ≥30 ppb and acid aerosol (n=15); and chronic exposure to acid aerosols (n=20). Individuals with diabetes or heart disease, or who had smoked in the preceding month were excluded. HRV was measured in all subjects during rest, paced breathing and active standing (Ewing manoeuvre). HRV was analysed in time and frequency domains and compared between the four exposure zones.
Results There were no significant differences between exposure zones in HRV, in either time or frequency domains, even after adjustment for age, gender, ethnicity and body mass index. There was no significant HRV change in three individuals in whom HRV was measured before and during an exposure to combined SO2 100–250 ppb and concentration of respirable particles of diameter ≤2.5 μ (PM2.5) >500 μg/m3. Age was significantly correlated with time-domain parameters during paced breathing and the Ewing manoeuvre.
Conclusions This study of healthy individuals found no appreciable effects of vog on the autonomic nervous system.
- Vog
- heart rate variability
- autonomic nervous system
Statistics from Altmetric.com
Introduction
Epidemiological studies show an association between urban air pollution and increased mortality and morbidity attributable to cardiovascular causes.1–3 Decreased heart-rate variability (HRV), an indication of disordered autonomic regulation of cardiac rhythm, can predict cardiovascular and all-cause mortality.4–7 Air pollution may induce lung inflammation and oxidative stress, which can cause cardiovascular distress,8–10 short-term perturbations in sympathetic activity and sympathovagal imbalance.11 Sulfur dioxide (SO2) can reduce vagal tone in asthmatic adults.12 Studies report associations between the concentration of respirable particles of diameter ≤2.5 μm (PM2.5) and changes in autonomic nervous system control as assessed by HRV in elderly volunteers.13 In addition, perturbations in sympathetic activity resulting in sympathovagal imbalance from short-term effects of air pollution are reported.14–17
The association between volcanic air pollution and changes in HRV is less well studied. Hawaii's Kilauea volcano has released 300–7000 tons of SO2 gas daily for more than 25 years, far more than any other stationary source in the USA.18 The SO2 reacts with water vapour, oxygen and sunlight to produce highly acidic, respirable particles. The blend of SO2 and acid aerosols that comprise volcanic air pollution is referred to locally as ‘vog.’
Hawaii Island's terrain and its prevailing wind patterns create zones of different exposures to volcanic air pollution (figure 1). Kilauea volcano is located on the southeast portion of the island. Kohala, at the northernmost tip of the island, is usually vog-free. It is protected from volcanic air pollution by the prevailing winds from the northeast and by Mauna Kea, the tallest mountain on the island. Volcano Village, located slightly north of Kilauea volcano's summit, is normally upwind of the source during prevailing trade winds. During wind reversals or low wind conditions, however, hourly concentrations of SO2 in Volcano Village can exceed 500 parts per billion (ppb). Ka'u district, 50 miles southwest and downwind of Kilauea's degassing vents, is chronically exposed, with ambient concentrations of SO2 of ∼30 ppb and PM2.5 of 10–15 ug/m3. Kona, west of Kilauea volcano, receives acid particulates that trade winds carry around the southern tip of the island. Diurnal on-shore, offshore wind patterns in the lee of the island can cause vog to linger on the Kona coast.
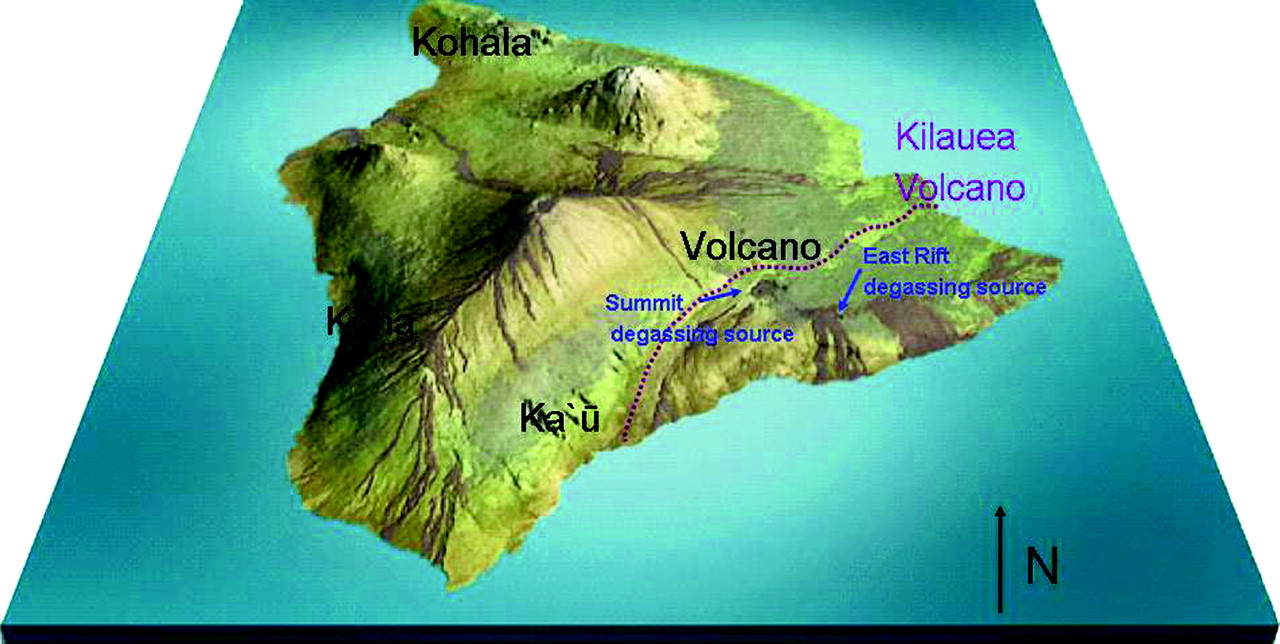
Geographic location of the four study sites on Hawaii Island, and major volcanic emission sources from Kilauea. Red dots represent the locations of the largest SO2 degassing sources on Kīlauea Volcano.
The objective of this study is to determine the association between volcanic air pollution and HRV. We tested the hypothesis that chronic exposure to volcanic air pollution disturbs sympathovagal balance. We measured HRV of individuals who live in the four different exposure zones: vog-free (Kohala), episodic high vog (Volcano Village), chronic SO2 ∼30 ppb and acid aerosol (Ka'u), and chronic high acid aerosol (Kona).
Methods
Estimates of SO2 and PM2.5
SO2 was measured in Volcano Village, Ka'u and Kona. On-line SO2 analysers were used in Volcano Village (Interscan 4240-DSP, Chatsworth, California) interfaced with data loggers (Campbell Scientific, Logan, Utah) and web-enabled. Hawaii State Department of Health monitoring provided SO2 data for Ka'u, starting in August 2007, and Kona, since 1997 (http://www.hiso2index.info/ and http://airnow.gov/). The Hawaii State Department of Health also provided PM2.5 data from Ka'u, starting April 2008, and Kona, starting March 2008.
Subjects
Men and women who were at least 18 years old were recruited from each of the four exposure areas according to a study protocol approved by the University of Hawaii Committee on Human Studies. Volunteers were recruited through newspaper advertisements, radio announcements, community letters and presentations at community meetings. Exclusion criteria were: personal history of diabetes or heart disease, current pregnancy and current smoking. Former smokers were included in the study if they had been smoke-free for more than 1 year. Height and weight were measured, and body mass index (BMI) was calculated as the body weight (kg) divided by the square of body length (m).
Heart-rate variability analysis
HRV was measured in all subjects during rest, paced breathing and active standing (the Ewing manoeuvre). Testing was conducted after at least an 8 h fast. Subjects rested for 30 min before testing. After a 5 min rest in the supine position, a trend of electrocardiographic signals was recorded by a bedside electrocardiographic monitor and transmitted to a personal computer for recording (BioPac Systems, Goleta, California). Continuous EKG interbeat intervals were monitored during the following three manoeuvres of 5 min duration each: resting, paced respirations at 12 breaths per min (0.2 Hz) and active standing. Paced respirations amplify the respiratory-related vagal modulation of the heart rate, whereas the initial fall in blood pressure during active standing activates baroreceptors with a subsequent reflex increase in sympathetic outflow and parasympathetic inhibition. Five-minute rest periods were given between each manoeuvre. The collection frequency was set at 1000/s.
HRV was analysed in time and frequency domains. The recorded electrocardiographic signals were retrieved afterwards to measure the consecutive RR intervals by using software for the detection of R waves (Acknowledge 3.7.1, Biopac Systems, Goleta, California). Sinus pause and atrial or ventricular arrhythmia were deleted, and 256 RR intervals were obtained for HRV analysis. Epochs that contained no ectopic beats were preferentially selected. If the percentage of deletion was >5%, the study was not included in the analysis. The time-domain measures were determined as follows. The SD of normal R-R intervals (SDNN) is the statistical measure of variability or spread of the R-R intervals around the average heart rate.19 Other time-domain measures such as the percentage of intervals greater than 50 ms different from its predecessor (PNN50) and the root of the mean square of successive differences (RMSSD) were calculated to capture subtle gradual trends in heart rate over time. The PNN50 and RMSSD provide additional measures of variability of the R-R intervals as well as confirmation of the SDNN.
Power spectral analysis was expressed as the area under the curve of power versus frequency.19 The power spectrum of R-R intervals was obtained by means of Fast Fourier transformation (Matlab version 6.5, Mathworks, Natick, Massachusetts). The area under the power spectrum within the range of 0.04–0.15 Hz and 0.15–0.4 Hz was defined as the low-frequency power and high-frequency power, respectively. The normalised high-frequency power (100×high-frequency power/total power) was used as the index of vagal modulation, and the low-/high-frequency power ratio was used as the index of sympathetic modulation.20 21
Statistical analysis
The anthropometric measures were presented as mean±SD. The mean R-R interval, SDNN, PNN50, RMSSD, low-frequency power, high-frequency power, normalised low-frequency power, normalised high-frequency power and low-/high-frequency power ratio were the HRV measures assessed in the study. The final spectral analysis results displayed are that of the normalised high-frequency power and low-/high-frequency power ratios, since these parameters best represent parasympathetic and sympathetic modulations. The O'Brien test was used to assess the homogeneity of variances between the study groups. Analysis of variance (ANOVA) was used to test for significant differences of baseline variables among groups. The Welch ANOVA was used to test for group differences of variables failing the test for homogeneity of variance. Specifically, attention was paid differences with the Kohala (vog-free) site. Categorical variables were compared using the χ2 test.22 Analysis of covariance (ANCOVA) was used to model HRV parameters as a function of groups and baseline variables that were found significant.23 Alpha was set at p=0.05. Statistical analyses were performed using JMP software version 5.1 (SAS Institute).
Results
Volcanic air pollution
The highest hourly SO2 level detected by our SO2 analysers in Volcano Village within 72 h before HRV testing was 453 ppb; PM2.5 was not continuously monitored in Volcano Village. Hourly SO2 levels in Ka'u were usually at 30 ppb. Concentrations of SO2 and PM2.5 in Ka'u, Kona and Kohala were estimated from 4-week integrated samples of SO2, and 2-week integrated samples of PM2.524–26 conducted between 2002 and 2005, when volcanic emissions were ∼1600 tons/day, and weather patterns were similar to the current study period. Our estimations of SO2 and PM2.5 at each site were consistent with ongoing monitoring by the Hawaii State Department of Health started in 2007 (http://www.hiso2index.info/ and http://airnow.gov/).
Subject characteristics
Seventy-two subjects from the four exposure zones were studied between April 2006 and July 2008. Characteristics of subjects from each zone indicate significant differences between the groups in percentage of men and in the mean BMI (table 1). Apparent differences in mean age and percentage of different ethnic groups did not reach statistical significance.
Baseline characteristics*
Autonomic function
None of the subjects was excluded because of ectopic beats greater than 5% of the total tachograms. There were minimal atrial and ventricular arrhythmias. Only four ECG tracings required modification due to ectopic beats. All time- and frequency-domain measures were normally distributed and did not require log transformation or use of non-parametric analysis. Age was significantly correlated with SDNN during paced breathing (r=0.20, p=0.04) and Ewing manoeuvre (r=0.22, p=0.05). This was supported by the significant correlation between age and PNN50 during paced breathing (r=0.31, p=0.008) and Ewing manoeuvre (r=0.26, p=0.02). No significant correlation was noted between age and RMSSD. No correlation was noted between age and frequency domain measures, such as high-frequency power and low-/high-frequency power ratio. No significant differences were noted between men and women in time- and frequency-domain measures.
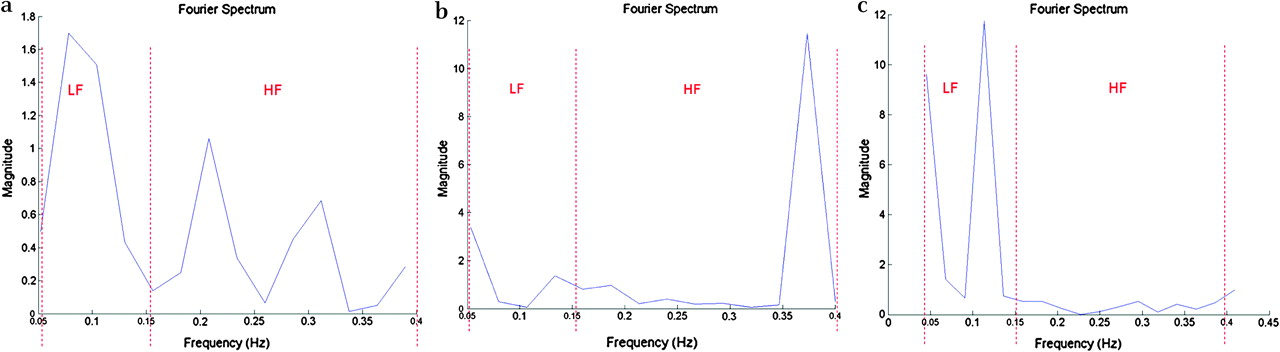
Time domain measures did not differ between the sites (table 2). Given the strong effects of age, and the unequal proportions of gender, ethnicity and BMI between sites, adjustment of these covariants was performed. There were no significant differences in time-domain measures between sites even after adjustment for these covariants. Figure 2 displays spectral analysis during (1) rest, (2) deep breathing and (3) Ewing manoeuvre. Frequency peaks were clearly delineated at each manoeuvre. There were no significant differences between the sites in the frequency domain variables, even after adjusting for gender, ethnicity and BMI (table 2). The low-frequency power, high-frequency power, and ratio of low- to high-frequency power were not significantly different between the four zones. Combining all the exposed zones into one (any exposure to volcanic pollution) group and comparing it with the vog-free zone did not reveal any significant differences in time and frequency domains.
Heart-rate variability according to sites around the active Kilauea volcano
Representation of spectral analysis during (A) rest, (B) deep breathing and (C) Ewing manoeuvre. HF, high-frequency power; LF, low-frequency power.
The observations in the cross-sectional study were further supported by a natural experiment in which increased emissions from Kilauea and conducive weather conditions caused SO2 to exceed 500 ppb and PM2.5 to exceed 500 μg/m3 in Ka'u on several occasions. We were able to repeat studies in three of our Ka'u subjects during such an episode. Despite these conditions, there was no change in intraindividual time- or frequency-domain measures before and after this high vog episode (data not shown).
Discussion
This is the first study to examine the effects of volcanic pollution on autonomic function as assessed by HRV. The study areas provide an uncommon opportunity because there is relatively little fossil fuel-derived air pollution in any area. This allows us to examine the long-term effects of SO2 and acid aerosols with little confounding by other pollutants through four volcanic air pollution exposure zones.12 27 These zones are determined by the rate of volcanic emission, wind speed and direction, distance from the source and terrain. SO2 and acid (sulfate) aerosol concentration at the times of HRV measurements were inferred from the volcanic emissions measured by the National Park Service/US Geological Survey and wind speed and direction, measured by the National Weather Service.25 26
Our study suggests that exposure to volcanic pollution, at the concentrations and composition that prevailed in these four zones between April 2006 and July 2008, is not associated with autonomic imbalance in healthy adults. These findings differ from an earlier study of 21 active 53- to 87-year old subjects in Boston, in which ambient PM2.5 (as high as 49 μg/m3) or ozone (as high as 77 ppb) were associated with significantly decreased SDNN and r-MSSD, with a combined effect of a 33% reduction in the mean r-MSSD.28 Similarly, a study of healthy young adults in Mexico City, each increase in PM2.5 of 30 μg/m3 in the 2 h before HRV measurement was associated with a significant decrease in pNN50.29 Indeed, a growing body of evidence confirms an association between PM2.5 or ozone and diminished HRV.1 3 10 One major reason for the difference in results is the different source and composition of Hawaii's volcanic air pollution. It does not result from combustion of carbonaceous fuels, as is typical of the ambient pollution in studies in urban or industrial settings. Fine particulates that result from volcanic emissions are mainly sulfates, with little or no organic or oxidant compounds. There is no secondary production of ozone, an inflammatory component of urban pollution.30
Our finding that SO2, even at concentrations that exceed 400 ppb, was not associated with decreased HRV differs from that of Tunnicliffe et al, who showed that SO2 of 200 ppb decreased HRV in 12 non-asthmatic and 12 asthmatic subjects.12 Routledge et al similarly demonstrated decreased vagal control after subjects breathed SO2 200 ppb.27 These chamber studies allowed the investigators to detect the time-dependent and transient nature of the response, which may have been missed in our field studies. We had also excluded current smokers. Several studies indicate that cigarette smoking not only directly decreases HRV but can synergistically augment the effect of SO2.31 32 HRV associated with small changes in ambient SO2 in Korea (4 h mean 6 ppb) was significantly reduced in 267 smokers compared with 700 non-smokers.33
This study is limited by its cross-sectional design and general, rather than individual, measures of exposure to air pollution. However, the individuals recruited were residents who lived in the area for at least 5 years and would have had chronic exposure to the different levels of volcanic air pollution. Although the distribution of age, gender, BMI and ethnicity differed between the areas, adjustment for these variables did not reveal any differences in HRV. The sample size may have been too small to detect changes described in larger studies; however, the sample size of the current study was selected to provide an 80% power to detect a significant difference for an SDNN of <30 ms, a clinically relevant prognostic indicator of all-cause and cardiovascular mortality.34 The chosen sample size also provided >80% power to detect an effect size of 0.2, considered a weak effect, among any of the other HRV outcomes, which none of the observed differences attained statistical significance at the 0.05 α level. Moreover, while the lack of significant findings could still be due to a lack of statistical power, there did not seem to be a consistent pattern of differences about the mean among each community, which supports our conclusions that the observed variability in the study parameters was due to random variation.
Conclusions
Our study found no appreciable influence of volcanic air pollution on the autonomic nervous system. The lack of significant differences between the groups exposed to different levels of air pollution may be due to excluding people who were more susceptible to autonomic dysfunction, exposure to predominantly SO2 gas and acid aerosols (and not organic compounds or strong oxidants), small sample size or a combination of all these factors. More studies are needed to increase our understanding of the effects of higher levels of volcanic air pollution, or its effects on susceptible individuals with comorbidities such as chronic obstructive pulmonary disease, asthma, diabetes and cardiovascular disease.35
Acknowledgments
We gratefully acknowledge J Orr, N Nicolaisen, Y Gilbert, H Linkee-Ciufo and J Warner, for their technical assistance and community coordination, and L Hsu and R Hoshide, for manuscript preparation.
References
Footnotes
Funding This investigation was supported by the United States Centers for Disease Control (CDC) grant 1R01 EH000111; Hawaii State Department of Health; American Lung Association of Hawaii; Leahi Fund, Hawaii Community Foundation. DCC is recipient of NIH grant K23 HL088981 and funding from NCRR 1 R25 RR019321. This manuscript is solely the responsibility of the authors and does not necessarily represent the official views of the NIH, CDC, Hawaii State Department of Health, American Lung Association of Hawaii, or Hawaii Community Foundation. The JMP statistical software licence was supported by NIH Grant number RR-16467 from the HS-BRIN programme of the National Center for Research Resources.
Competing interests None.
Ethics approval Ethics approval was provided by the University of Hawaii Committee on Human Studies.
Provenance and peer review Not commissioned; externally peer reviewed.