Article Text

Statistics from Altmetric.com
- Focal atrial tachycardia
- electrocardiogram
- intracardiac electrogram
- cardiac electrophysiological study
- computer-assisted three-dimensional imaging
- arrhythmias
- endocardial map
- radiofrequency ablation (RFA)
- 12 lead ECG
- atrial fibrillation
- channelopathy
Introduction
Focal atrial tachycardia (AT) is the least common form of supraventricular tachycardia. However, the surface 12-lead ECG is a very helpful tool and the use of P-wave morphology (PWM) on surface ECG to localise the site of focal AT is of paramount importance. Subtle ECG changes with respect to PWM in AT could be mistaken as sinus rhythm (SR). We report a case of a young woman with focal AT located at the tricuspid annulus in which the heart rate in both SR and AT were similar. The only subtle difference was in the PWM on surface ECG in lead V1. With the use of electroanatomical mapping the subtle surface ECG changes could be explained.
Case
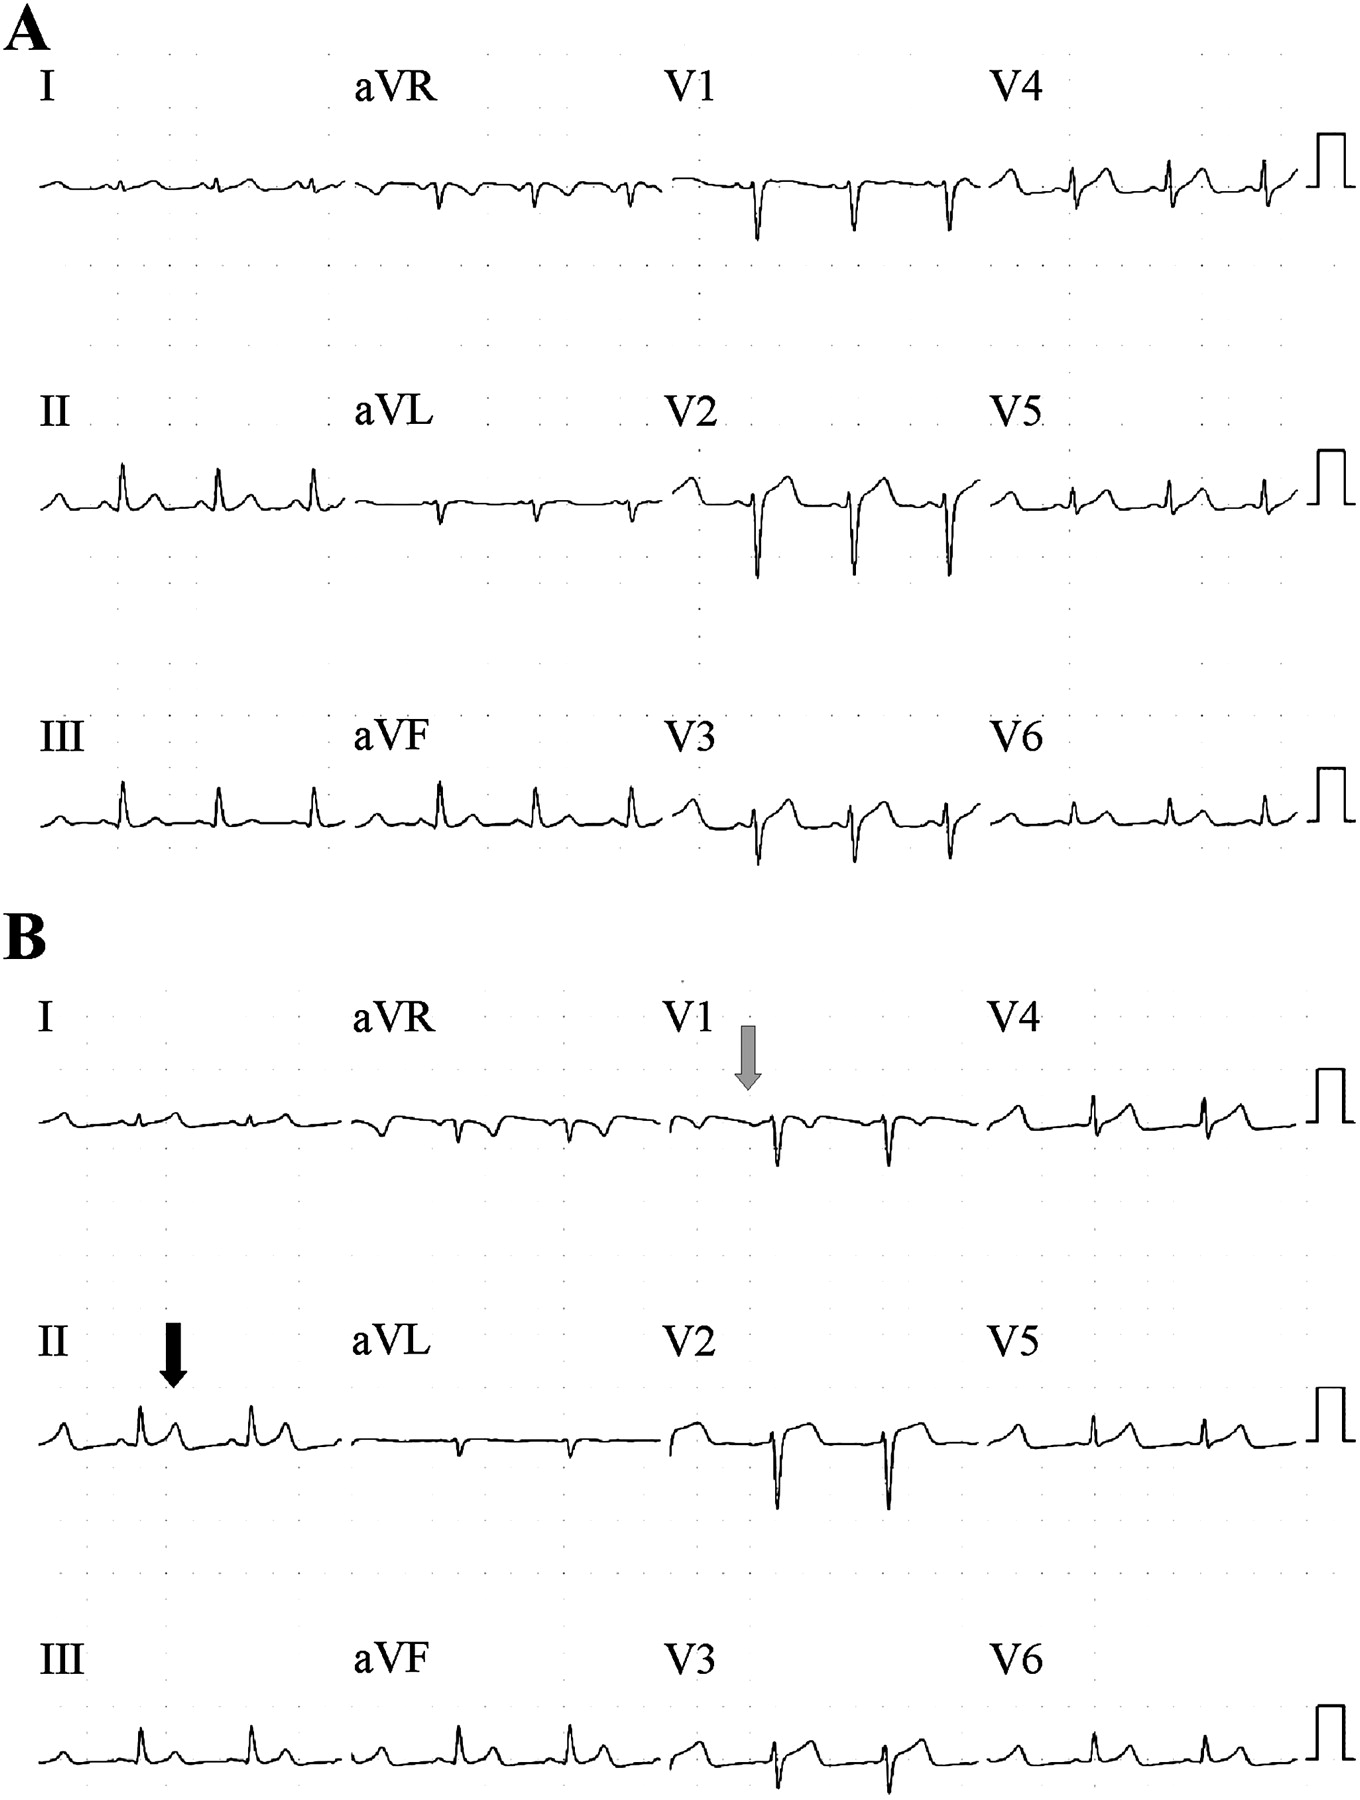
A 17-year-old woman presented with a history of palpitations. She had been symptomatic since the age of 9 years and had been treated with digoxin previously. The only documentation of tachycardia was a single lead recording made 9 years ago which showed a narrow complex tachycardia. She was listed for electrophysiological study and ablation. Prior to the procedure two ECGs were recorded, one on the morning of admission (figure 1A) and the other at the beginning of the procedure (figure 1B). Both were reported as SR. Although heart rates in two ECGs are very similar, there is a clear difference in PWM. When compared with ECG in figure 1A, ECG in figure 1B shows inversion of P wave in lead V1 (grey arrow) and a subtle peaked appearance of T wave in lead II (black arrow).

12-lead surface ECGs: (A) Sinus rhythm; (B) Atrial tachycardia.
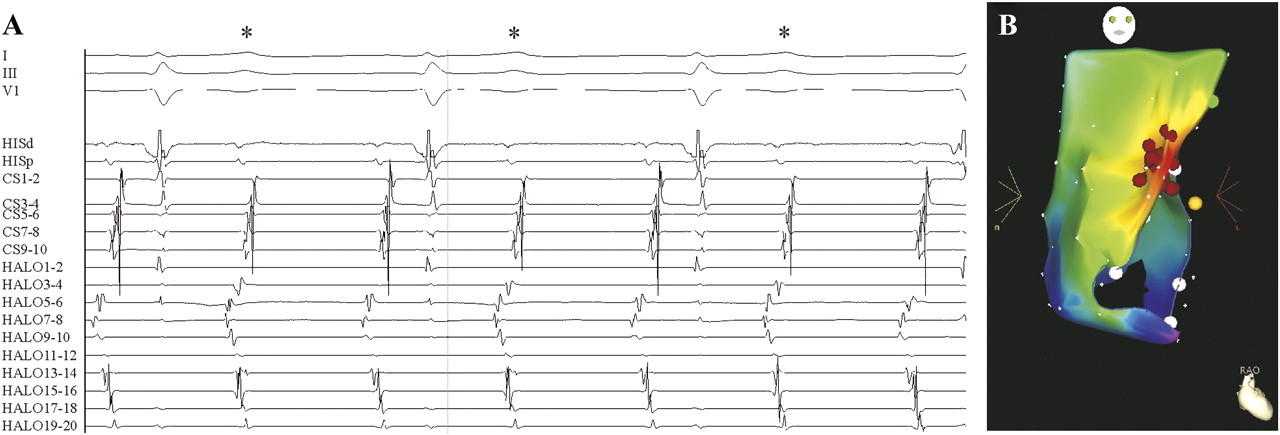
Figure 2A shows intracardiac signals recorded by the electrophysiological catheters. AT with 2:1 block was revealed where alternate atrial signal occurred simultaneously with the T wave (*), explaining the odd T wave appearance in lead II. Using the CARTO system (Biosense Webster, Diamond Bar, California, USA) the tachycardia source was mapped to superior tricuspid annulus where it was successfully ablated (figure 2B).
(A) Recording of surface and intracardiac electrogram during atrial tachycardia (AT): I-V1, surface leads; HIS, His-catheter; CS, coronary sinus; HALO, catheter around tricuspid annulus. (B) Electroanatomical map of the AT showing site of origin of AT at the superior aspect of tricuspid annulus. The red dots represent ablation lesions. L, left; R, right; RAO, right anterior oblique.
This case illustrates the importance of close interpretation of the ECG as PWM and can be helpful in differentiating SR from AT on the 12-lead surface ECG.1 Tricuspid annulus is the second most common site of origin of right AT. A common feature of tricuspid annular AT is presence of an inverted P-wave in V1 and V2 with late precordial transition to an upright appearance.2
Acknowledgments
We would like to thank James Mason, Cardiac Physiologist, for assisting in performing the ablation procedure and extracting and modifying images from the Carto system.
Footnotes
Funding KLL is the recipient of New Zealand National Heart Foundation Overseas Training & Research Fellowship.
Competing interests None.
Patient consent Obtained.
Provenance and peer review Not commissioned; internally peer reviewed.