Article Text

Abstract
Background Aortic pulse wave velocity (APWV), a marker of arterial stiffness, was found to be a good predictor for the presence of incipient vascular disease and cardiovascular events in observational studies. APWV measured by echo Doppler is a simple and readily available method comparable with other costlier and complex modalities of APWV measurement like MRI, Complior method or applanation tonometry.
Aims and objectives No previous studies have demonstrated a relationship between APWV findings and the complexity of coronary artery disease (CAD). Our aim was to examine the relationship between APWV findings and the severity of SYNTAX scores (SX scores).
Methods 500 patients who had undergone APWV measurements and elective coronary angiography from September 2012 to June 2013 were taken. Pulsed Doppler ultrasound (6.6 MHZ) probe with ECG synchronisation was used to calculate APWV. SYNTAX scoring was performed by observers who were blinded to APWV values.
Results A significant, nearly linear correlation between APWV and advancing CAD (p<0.0001) was observed. Patients with dual-vessel and triple-vessel disease had significantly higher APWV than patients without CAD. It was also found that mean APWV values were significantly more in patients with high or intermediate SX scores than in patients with low SX scores. The Fischer's linear discriminant analysis showed a cut-off value of APWV for predicting the possibility of having CAD to be >11.5 m/s.
Conclusions APWV has predictive value for the SX score. A positive relation exists between aortic stiffening and coronary atherosclerosis and APWV measured by 2D Doppler is a good predictor of advancing CAD.
- AORTA, GREAT VESSELS AND TRAUMA
- CORONARY ARTERY DISEASE
Statistics from Altmetric.com
Introduction
Before taking up a patient for an invasive cardiac catheterisation procedure, guidelines recommend a non-invasive risk assessment. However, the currently available non-invasive modalities are insufficient for accurate coronary angiography (CAG) risk assessment. Even after performing tests like ECG, stress test, echocardiogram radio nucleotide or other imaging modalities, prior to cardiac catheterisation, the predictive value remains only 40%.1–4
The 2007 European Society of Cardiology Guidelines for Arterial Hypertension management suggest carotid–femoral pulse wave velocity (PWV) as the ‘gold standard’ for measuring arterial stiffening. This simple, non-invasive, readily reproducible modality provides an accurate extensive assessment of central aortic stiffness.5–7
Arterial stiffness
Arteriosclerotic vascular disease progression and advancing age cause thickening of arterial wall and decreased elasticity leading to arterial stiffening.
Arterial stiffening is now considered as a relevant marker in cardiovascular risk assessment and incipient vascular disease detection. Safar et al8 and Laurent and Boutouyrie9 have shown that this parameter has an independent predictive value for cardiovascular mortality in subjects having type 2 diabetes mellitus, hypertension and chronic kidney disease.
There are many methods available for evaluating the stiffness of arteries. Among this, carotid–femoral PWV is considered the gold standard due to its relative easiness and reliability and is shown to have an association with cardiovascular disease independent of conventional risk factors in various population based studies.10
Pressure wave travelling through the wall of an artery is influenced by the biological and mechanical properties of that blood vessel. Arterial stiffening causes pulse wave to be transmitted at a greater speed. Hence a higher PWV suggests stiffened arteries. Advancing age and effects of progressive atherosclerotic process on vascular tree lead to increased aortic pulse wave velocity (APWV).11
The length between the points of placement of Doppler probe in carotid and femoral arteries in metres (L) is divided by transit time (TT) measured in seconds to get carotidofemoral APWV. TT refers to time taken by pulse wave to cover the specified length. Therefore, PWV=L/TT.12–14
TT shows variability based on properties of arterial wall, cardiac conduction system and rhythm.
PWV is generally measured using mechanotransducers (Complior method) and applanation tonometry. Doppler ultrasound and MRI are less commonly used modalities.
Complior method, applanation tonometry and MRI are highly reliable but have the disadvantages of requiring specific equipments and are costly and not suitable for population based studies.
These shortcomings can be avoided by measuring PWV using Doppler. PWV by Doppler assumes that the actual pulse wave is in correspondence with spectral Doppler flow wave. The ABC study has made use of this method to determine APWV cost effectively.15–22
Calabia et al23 showed that PWV measured by mechanotransducers (Complior method) and PWV estimated by Doppler guided by 2D ultrasound are similar, and can be used reliably in the measurement of arterial stiffness. Sutton-Tyrrell et al24 showed that APWV measured by Doppler is comparable with that calculated using an applanation tonometer.
Common carotid and femoral arteries are preferred for PWV measurement because they are superficial and inter-arterial distance covers almost the entire aortic diameter. Aorta is the most common blood vessel susceptible to stiffness.
In healthy persons 24–62 years old, the APWV is generally 6–10 m/s. Among hypertensive subjects, an APWV >13 m/s may predict individuals at a high cardiovascular risk.25
No former reports have studied the relationship between APWV velocity and complexity of coronary artery disease (CAD).
The SYNTAX trial has shown that SYNTAX score (SX score), representing lesion complexity, has correlation with primary and secondary end points in subjects undergoing percutaneous coronary intervention (PCI)/ coronary artery bypass grafting (CABG).26 ,27
Aims and objectives
-
No former reports demonstrated a relation between APWV, a marker of aortic stiffness, and the complexity of CAD.
-
Our aim was to find out a relationship between APWV and the severity of the SX scores.
Study patients
All patients admitted to the cardiology department, Government TD Medical College Alappuzha, Kerala, India, from September 2012 to June 2013 who underwent first elective coronary angiography and APWV measurements were considered. Elective coronary angiograms were done at least 2 weeks following an acute coronary event. All measurements were taken 1 day prior to CAG by the same operator.
Indications for coronary angiography were: (1) evaluation of ischaemic heart disease or cardiomyopathy and (2) prior to CABG, aortic or valvular heart disease surgery or as preoperative investigation for patients with a history of CAD with positive non-invasive test results. Written informed consent was procured from every patient. Angiographic SYNTAX scorings were performed by observers blinded to APWV measurements.
Exclusion criteria
Patients having non-palpable carotid or femoral pulse, carotid or femoral bruit, any condition which interferes with proper measurement of both upper limb and lower limb blood pressure (eg, filarial lymphangitis, limb amputation) or conditions causing difficulty in measuring carotid pulse wave (very obese, short neck) and so on were excluded from the study. Patients who previously underwent PCI/CABG, carotid or peripheral interventions or having cardiac rhythm disturbances, severe valvular heart disease and aortic prosthesis were also excluded from study. All patients undergoing CAG immediately following acute coronary events and all haemodynamically unstable patients were excluded from the study.
Methods
PWV measured by Doppler
Even though simultaneous analysis of carotid and femoral waveforms is impossible, they are standardised by separate measurements using (ECG) (gating) as proposed by Calabia et al.23 Millasseau et al28 have shown that pulse TT analysed either simultaneously or in sequence will not produce any error under stable cardiovascular conditions.
Pulsed Doppler probe with a Linear Array (6.6 MHZ) having ECG synchronisation (MyLab 50, Esaote, Florence, Italy) was used for the study. The patients were asked to take rest in lying down position for 5 min before examination. The common carotid artery was located above the clavicle using B-mode.
Pulse Doppler waveform was identified along with ECG. This procedure was repeated for common femoral artery in groin. Three recordings from each site were performed.
A single recording involved three cardiac cycles. For finding the TT, the time from peak of R wave of QRS complex to foot of pulsed Doppler wave was measured by digital callipers (figure 1). An average of six heart rate measurements were taken.23
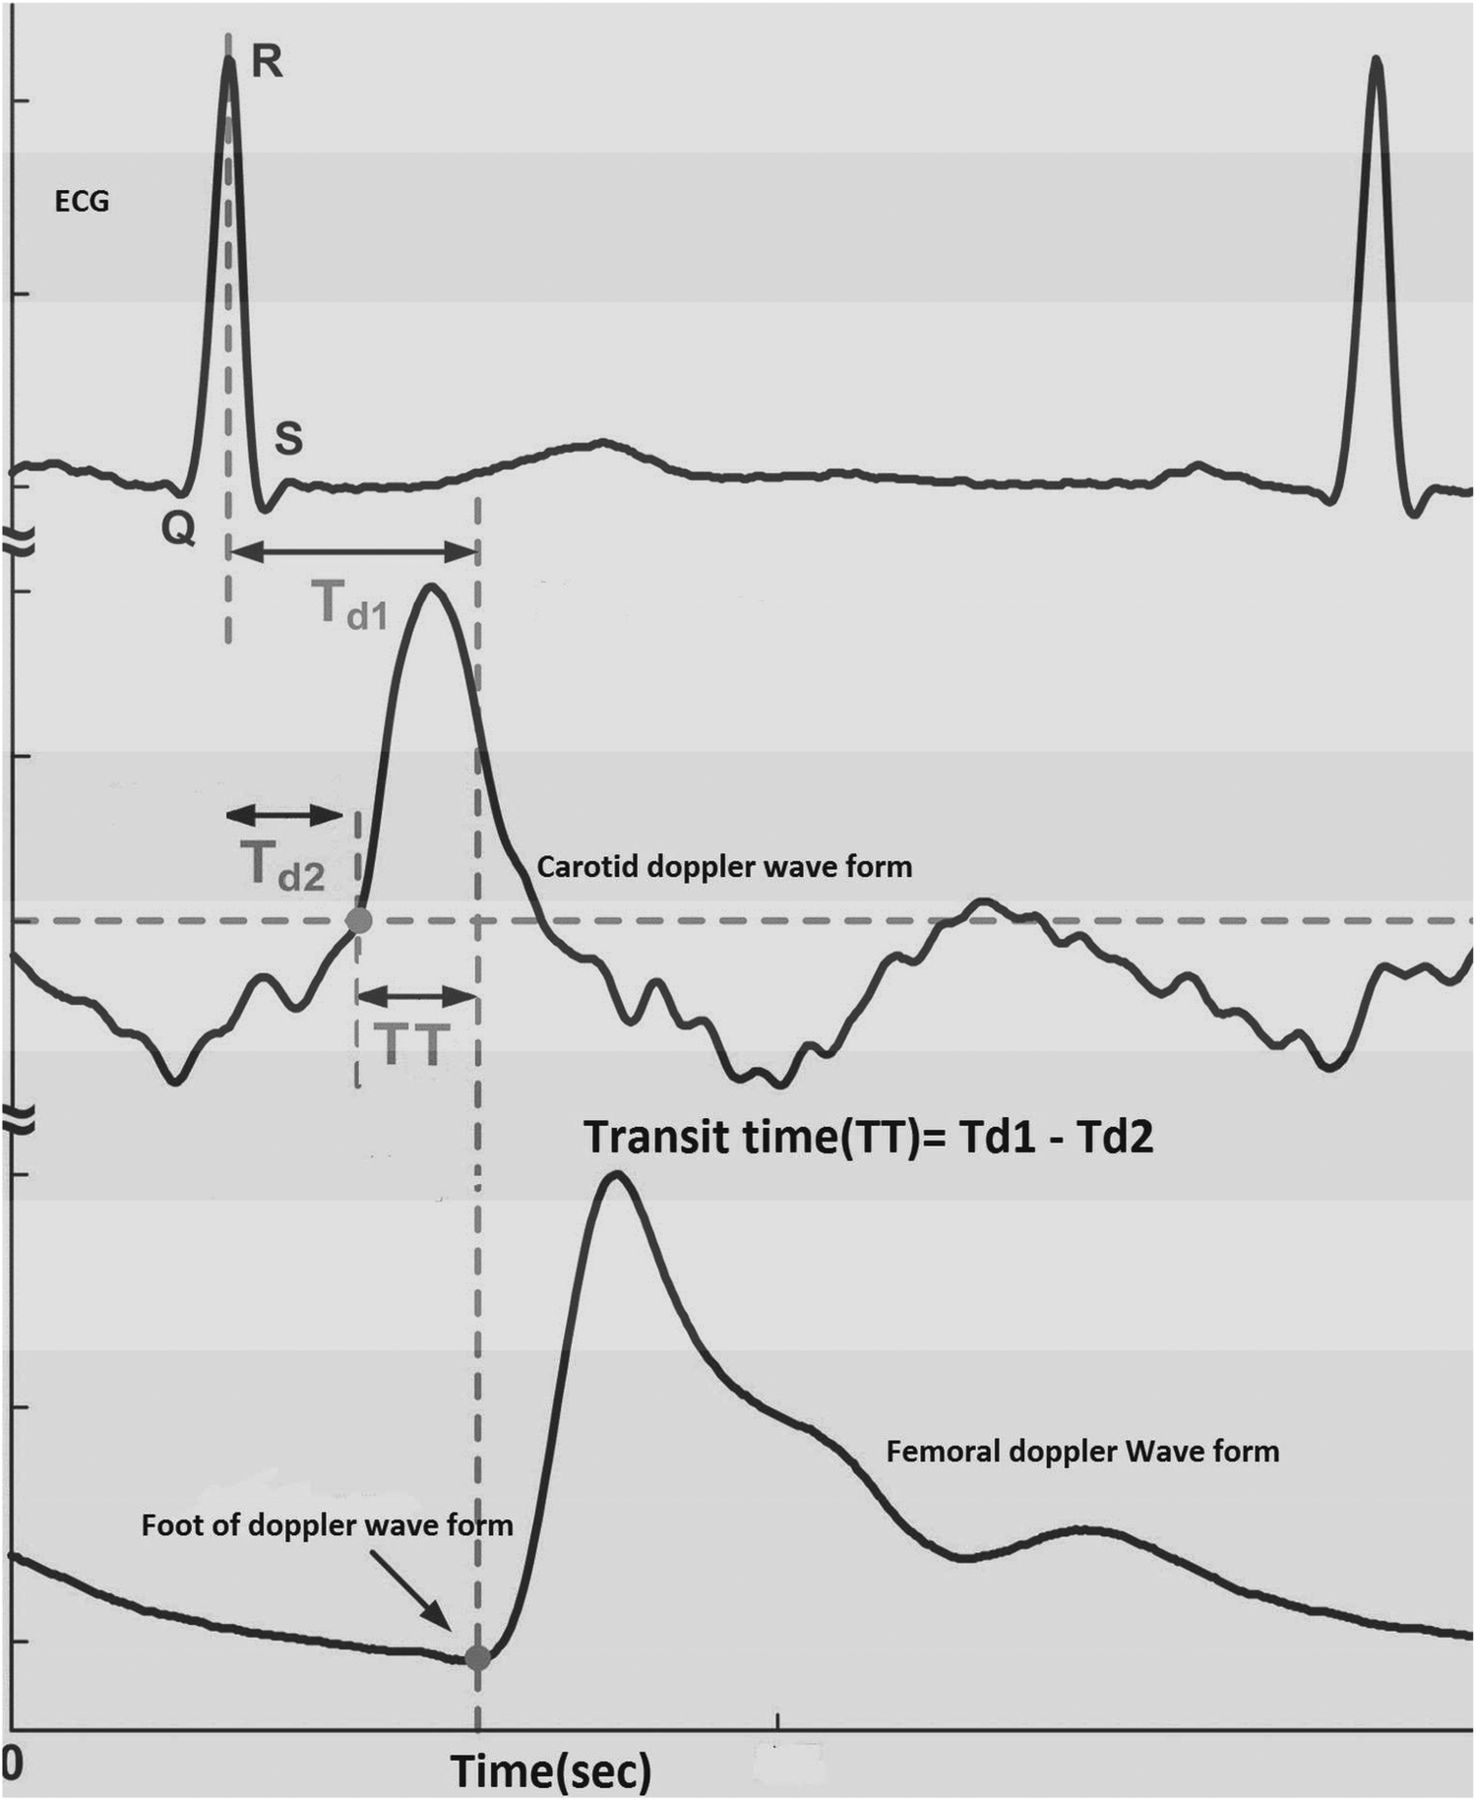
Assessment of transit time using pulsed Doppler ultrasound after ECG gating.
The distance between carotid and femoral artery points where Doppler probe is kept was measured using measuring tape. In order to minimise body contour influences, the measuring tape was placed above body surface, parallel to the plane of the examination table.
The length between the points of placement of Doppler probe in carotid and femoral arteries in metres (L) is divided by TT measured in seconds to get carotidofemoral APWV (figure 2). Therefore, PWV=L (m)/TT (s).12–14

Carotid–femoral pulse wave velocity determination.
But usage of superficial distance measurement revealed higher APWV values compared with those obtained using MRI or invasive measures. Hence, a scaling factor of 0.8 derived from Huybrechts et al was used for converting APWV obtained using superficial distance measurement to ‘real’ PWV.29
Real APWV=(0.8×superficial measurement)/TT
Assessment of TT using pulsed Doppler ultrasound after ECG gating is given in figure 1.
Laboratory methods
Baseline biochemistry included fasting blood sugar, 2 h postprandial blood sugar, complete fasting lipid profile, liver function tests and renal function tests.
Echocardiography
Echocardiography was done for assessing systolic and diastolic function of left ventricle (LV).
SX score and angiographic analysis
From the coronary angiography report, coronary lesions producing ≥50% luminal narrowing in arteries having ≥1.5 mm width were scored separately. The sum total of these scores gives the total SX score, analysed SX score algorithm. This algorithm is freely accessible from SYNTAX website. Scores were grouped as (1) low (0–22), (2) intermediate (23–32) and (3) high (33 and above) SX scores. SYNTAX scoring was done by observers who were blinded to APWV, carotid artery intima media thickness and ankle brachial index values.
Statistical analysis
Continuous variables were expressed in mean±SD and categorical variables in numbers with percentage. Continuous variables were compared using Student t test after assessing Gaussian assumption and categoric variables using χ2 test.The association of APWV with other variables was ascertained using regression analysis. Fischer's linear discriminant analysis was performed for finding the optimum cut-off for APWV which best discriminates normal and diseased patients. A receiver operating characteristic (ROC) curve was constructed for testing the diagnostic accuracy of the discriminant function scores. The descriptive and inferential statistical analysis of data was performed using SPSS V.17.0 software for Windows.
Observations
Patient profiles
Table 1 shows the patient profiles. The median for age was 68 years; 308 (61.6%) were men and 192 (38.4%) women, 128 (18.4%) had diabetes mellitus, 276 (55.2%) had hypertension and 172 (34.4%) had dyslipidaemia. The median values of the mean APWV, mean carotid intima-media thickness (CIMT) and the mean ankle-brachial index (ABI) were 13.06 m/s, 1.05 mm and 1.05, respectively.
Patient profiles
The indications for coronary angiography, angiographic data and SX scores are described in table 2. Low (0 to 22), intermediate (23 to 32) and high (33 and above) SX scores were seen in 354 (70.8%), 92 (18.4%) and 54 (10.8%) patients, respectively. The SX score of 96 patients (19.2%) was 0.
Angiographic indications, data and SYNTAX scores
Overall mean APWV for all 500 subjects was 13.06±1.97 m/s. The mean APWV was more in men (14.16 m/s), subjects with hypertension (13.55 m/s), smoking (13.87 m/s), diabetes (14.82 m/s), total cholesterol >200 mg/dL (13.75 m/s), low-density lipoprotein (LDL)>100 mg/dL (13.80 m/s), triglycerides >150 mg/dL (13.42 m/s), high-density lipoprotein (HDL)-cholesterol <40 mg/dL (13.10 m/s) and patients with one LV diastolic dysfunction (15.05 m/s) when compared with women (12.97 m/s), subjects who are non-hypertensive (12.44 m/s), non-smokers (12.53 m/s), non-diabetics (12.43 m/s), total cholesterol <200 mg/dL (12.09 m/s), LDL<100 mg/dL (12.05 m/s), triglycerides<150 mg/dL (13.11 m/s), HDL >40 mg/dL (12.96 m/s) and subjects having normal LV diastolic function (12.61 m/s).
The p value was significant for mean APWV in hypertensives (p=0.004), smokers (p=0.001), patients with diabetes (p<0.001), total cholesterol>200 mg/dL (p<0.01), LDL>100 mg/dL (p=0.004) and LV diastolic dysfunction (p<0.001). Even though there was a higher mean APWV in subjects having low HDL and high triglyceride levels, the p value was not significant (p=0.078 and p=0.09, respectively). Subjects having a low LV ejection fraction <40% had lower APWV compared with subjects with normal LV ejection fraction, but not having any statistical significance (table 3).
Different parameters versus mean APWV
A comparative analysis of APWV and risk factors was carried out and from these data statistically significant elevated APWV was found in multiple and double risk factors when compared with double and single risk factors, respectively. Patients with three or more risk factors were having higher APWV (15.1 m/s) than patients with two or less risk factors (12.7 m/s) and p value was found significant (p<0.05).
Angiographic results showed that 96 patients (19.2%) had normal vessels or <50% stenosis, 176 (35.2%) had single-vessel disease (SVD), 94 (18.8%) had two-vessel disease (2VD), 112 (22.4%) had triple-vessel disease (TVD) and 22 (4.4%) had left main and TVD. The mean APWV for subjects having normal coronaries was 11.15±1.73 m/s and in patients with angiographic-proven CAD it was 13.50±1.75 m/s. The mean APWV was found to be 11.74, 13.80 and 15.52 m/s in single-vessel, two- vessel and three-vessel CAD, respectively (figure 3).
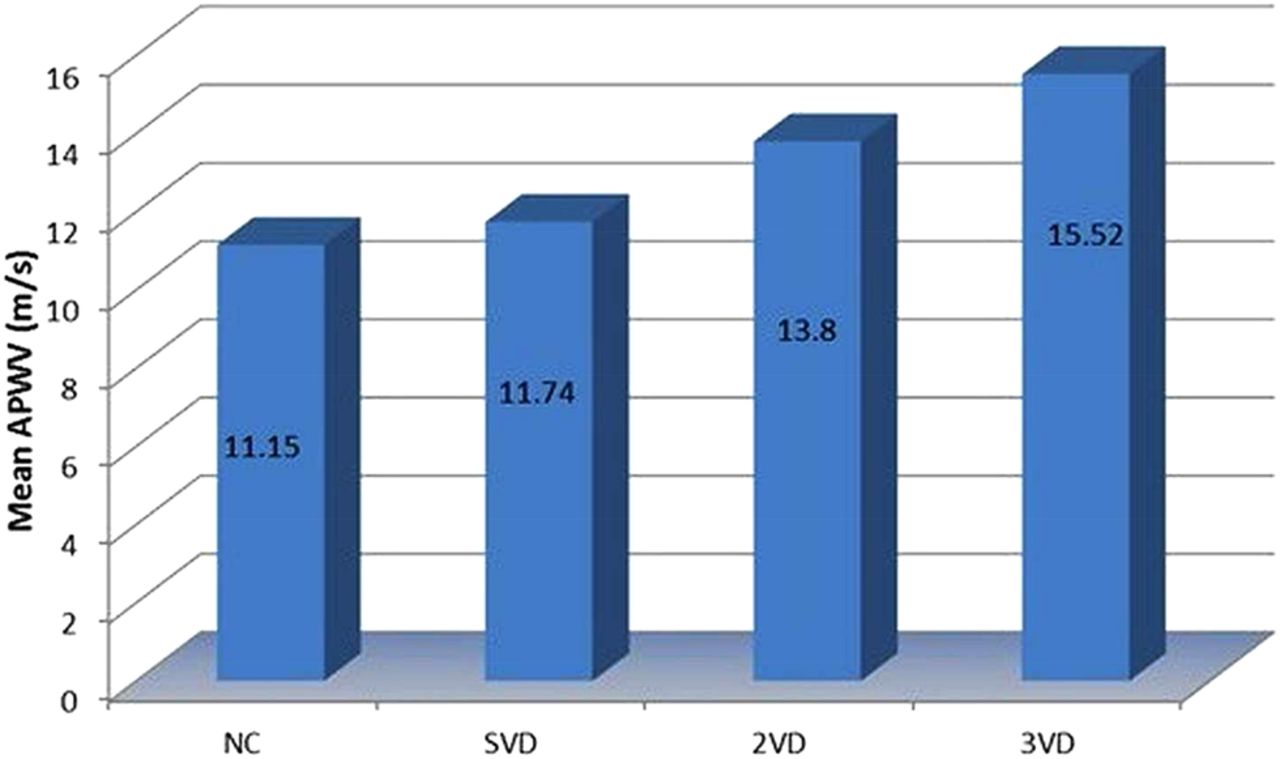
Mean aortic pulse wave velocity (APWV) in different groups. NC, normal coronaries; SVD, single vessel disease; 2DV, two vessel disease; 3VD, triple vessel disease.
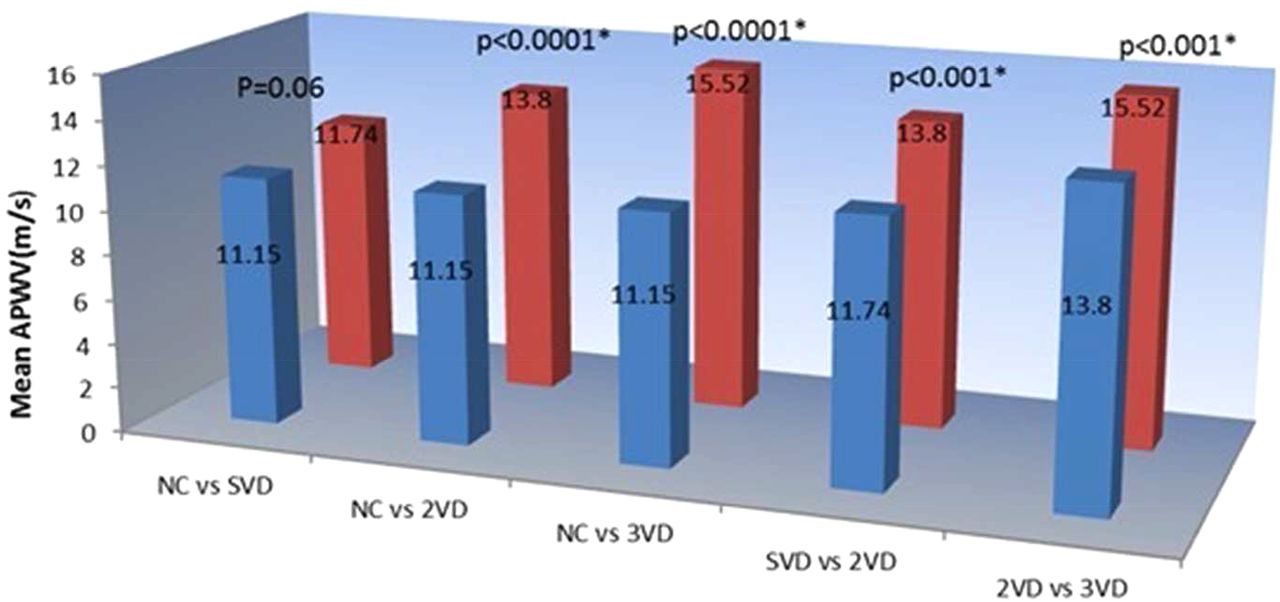
A nearly linear correlation between APWV and advancing CAD (p<0.0001) was observed. Subjects having 2VD and TVD had a significantly higher APWV than subjects having normal coronaries. Even though mean APWV was higher in patients having SVD (11.74 m/s) compared with subjects with normal coronaries (11.15 m/s), the difference proved insignificant on statistical analysis (p=0.067) (figure 4). There were significant differences in mean APWV on comparing patients with SVD and 2VD (p=0.0025). This difference was also noted between 2VD and TVD (p<0.0001) (figure 4).

Correlation of mean aortic pulse wave velocity (APWV) with coronary artery disease (CAD). NC, normal coronaries; SVD, single vessel disease; 2DV, two vessel disease; 3VD, triple vessel disease. *indicate statistically significant
Univariate logistic regression analysis showed that increased APWV levels along with diabetes, hypertension, smoking, total cholesterol and LDL-cholesterol have a significant association with complex CAD (table 4).
Univariate analysis of determinants of SYNTAX score
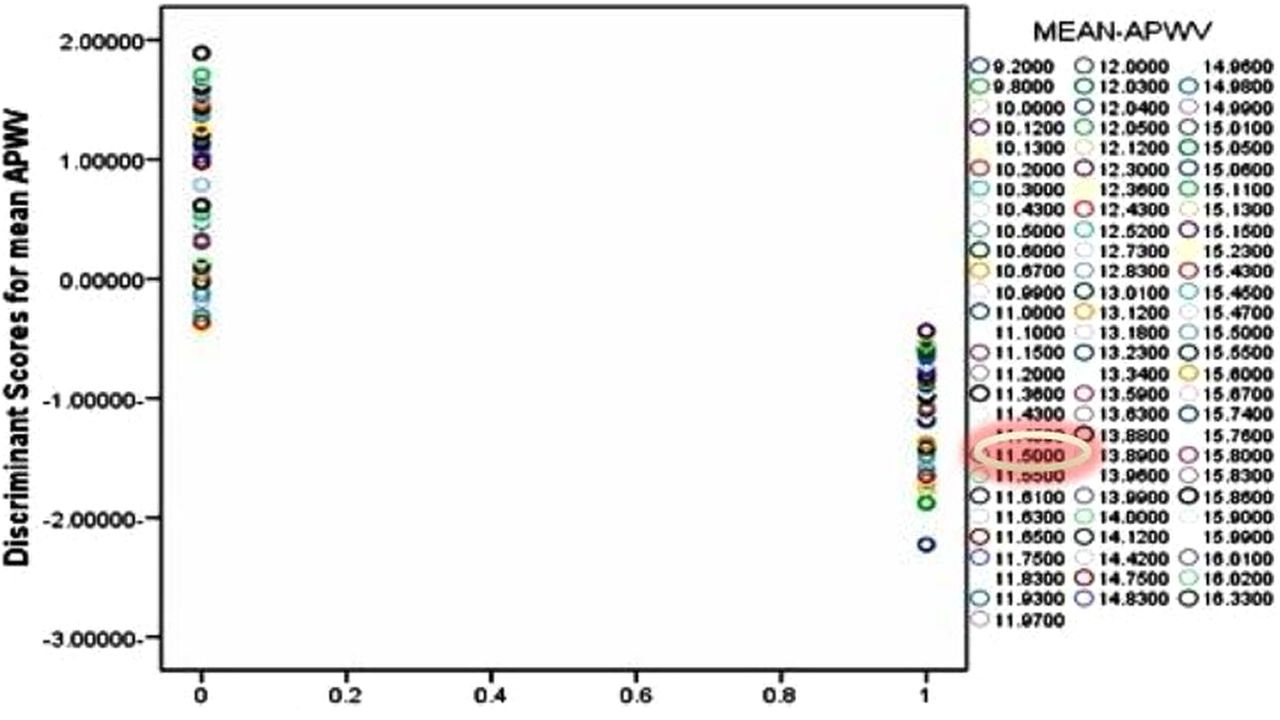
Fischer linear discriminant analysis was performed for finding a cut-off value of APWV which helps to discriminate normal subjects from those having CAD and it was found to be 11.5 m/s (sensitivity 95%, specificity 62%) (figure 5). An ROC curve constructed using discriminant values also showed good diagnostic accuracy. The area under curve ranged from 0.766 to 0.975.

Fischer linear discriminant analysis for finding the cut-off value of aortic pulse wave velocity (APWV) which helps to discriminate normal subjects from those having coronary artery disease (CAD).
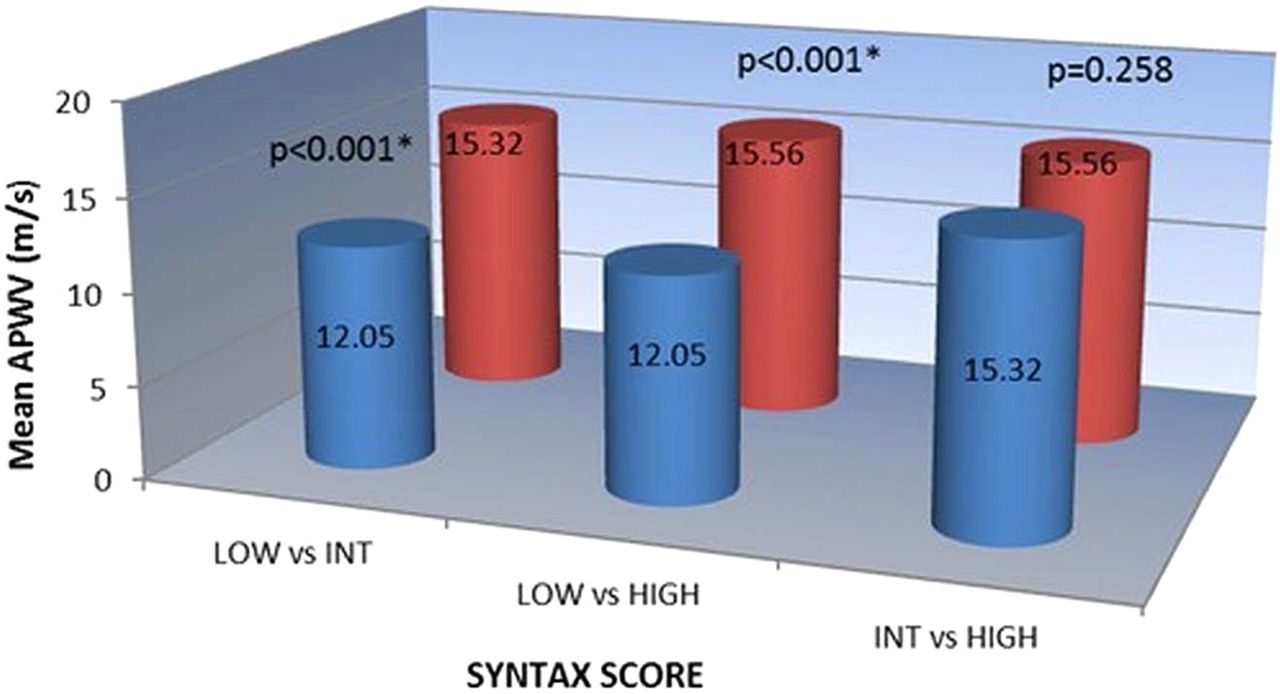
It was found that the mean APWV values in patients with high (>33), intermediate (22–33) and low SX scores of CAD were 15.56, 15.32 and 12.05 m/s, respectively (figure 6). Correlation of SX score of CAD with APWV was checked and subjects with high and intermediate SX scores on comparison with low SX scores had elevated mean APWV values (p<0.001) (figure 6). Even though mean APWV was higher in subjects having high SX Scores (15.56 m/s) compared with subjects with intermediate SX scores (15.32 m/s), the difference did not have any statistical significance (p=0.258).

Correlation of SYNTAX score of coronary artery disease (CAD) with aortic pulse wave velocity (APWV). Low=0−22; Intermediate (INT)=23−32; High=≥33. *indicate statistically significant.
Discussion
The principal finding of our research was that APWV findings correlate with the complexity of CAD. Multiple former reports have shown an association between increased APWV findings and adverse coronary events. But CAD severity evaluation in all these studies was limited to history and number of myocardial infarction/unstable angina and its prognostic value for future coronary events. None of these trials addressed the relationship between mean APWV findings and the complexity of CAD.30–35
In our study, we used the Doppler method to calculate APWV. This method provides a simple, accurate, reproducible and non-invasive assessment of central aortic stiffening. Many authors have suggested some limitations of this method.
(1) The superficial measurements provide an estimated distance travelled by pulse wave and true distance can only be obtained by invasive procedures.25 (2) Since pulse waves travel in opposite directions in carotid and femoral arteries, APWV determination using a carotid pulse instead of aortic arch pulse can introduce error. (3) Superficial measurement underestimates the true path length of pulse in the elderly as the arteries become longer and tortuous with advancing age.36
To overcome these limitations in our study, we used a scaling factor of 0.8 derived from Huybrechts et al29 for converting APWV procured by superficial distance measurements to ‘real’ APWV. The tape measured distances between carotid and femoral arterial points multiplied by 0.8, which corresponds best with the real distance covered by aortic pulse wave and comparable with MRI values. Boutouyrie used this scaling factor to accurately measure APWV in a large population based study.37
The present study demonstrated a positive correlation between APWV and conventional atherosclerotic risk predictors. This study is in line with the study conducted by Blacher et al25 who observed a higher mean APWV in men, advancing age and in subjects with diabetes, hypertension, dyslipidaemia and smoking. Patients particularly with multiple risk factors were having elevated APWV. In this study, our main finding was that arterial stiffness has a significant relationship with severe CAD, defined as left main stenosis—CAD, TVD or 2VD.
This study showed reduced APWV in subjects having an LV ejection fraction <40%. This may be due to the reduced mean arterial pressures as a result of decreased stroke volume and LV afterload in subjects having an LV systolic dysfunction.
Subjects with an LV diastolic dysfunction showed significantly high APWV on comparison with those having normal LV diastolic parameters. Ibrahim el-SH et al observed similar findings in an MRI based study and showed evidence of both aortic and LV stiffening in heart failure with preserved ejection fraction (ie, HFpEF). So, aortic stiffness has to be considered as a major input in HFpEF and follow-up APWV values may be useful for studying the effects of various treatment options.18 Furthermore, in subjects with impaired LV diastolic function, increased APWV reflects the possibility for advanced CAD.
This study is perhaps the first of its kind to introduce a cut-off value of APWV for predicting the possibility of having CAD. Based on Fischer linear discriminant analysis, the cut-off value for APWV beyond which there is a possibility of having CAD based on these data was found to be 11.5 m/s.
Hence, it is concluded that APWV is a simple, cost effective, reproducible, non-invasive tool to evaluate CAD. A positive correlation between aortic stiffening and coronary atherosclerosis was observed. APWV measured by Doppler can accurately predict the presence of multi vessel CAD and may prove useful for routine non-invasive risk stratification.
References
Footnotes
-
Contributors All authors were involved in discussions regarding study design and conduct. In order to prevent inter-observer bias, all aortic pulse wave velocity measurements were done only by RR one day prior to elective CAG. TGB, VG, KGM and PD helped RR in collection of data regarding risk factors, LV systolic and diastolic functions and blood investigations of all patients undergoing elective CAG and APWV measurements. KS, VJ, KSM and VVR were involved in SYNTAX score analysis of patients involved in study. Final data analysis and interpretation were done by RR.
-
Competing interests None.
-
Patient consent Obtained.
-
Provenance and peer review Not commissioned; externally peer reviewed.