Article Text

Abstract
Objective About one-fourth of Nepalese adults are overweight or obese but no studies have examined their risk factors, especially pertaining to diet. The present study aimed to identify dietary patterns in a suburban Nepalese community and assess their associations with overweight and obesity prevalence.
Methods This cross-sectional study used data from 1073 adults (18 years or older) participating in the baseline survey of the Dhulikhel Heart Study. We derived major dietary patterns from a principal component analysis of reported intake from a Food Frequency Questionnaire. Overweight was defined as Body Mass Index (BMI) of 25 kg/m2 or higher and obesity was defined as BMI of 30 kg/m2 or higher. Statistical analysis was conducted using generalised estimating equations with multivariate logistic regression (with household as cluster) adjusting for age, sex, ethnicity, religion, marital status, income, education, alcohol consumption, smoking, physical activity and systolic blood pressure.
Results Four dietary patterns were derived: mixed, fast food, refined grain–meat–alcohol and solid fats–dairy. The refined grain–rice–alcohol pattern was significantly associated with overweight (adjusted OR 1.19, 95% CI 1.03 to 1.39; p=0.02) after adjusting for demographic and traditional cardiovascular risk factors. In adults of 40 years or older, the fast food pattern was associated with obesity controlling for demographic and traditional risk factors (adjusted OR 1.69, 95% CI 1.19 to 2.39; p value=0.003).
Conclusions Our results suggest that refined grains–meat–alcohol intake is associated with higher prevalence of overweight, and fast food intake is associated with higher prevalence of obesity in older adults (40 years or above) in suburban Nepalese adults.
Statistics from Altmetric.com
Background
Obesity is a multifactorial chronic disease that develops from an interaction of the environment and genotype.1 ,2 Obese adults are at an increased risk of major diseases such as hypertension, type 2 diabetes, cardiovascular disease (CVD) and certain cancers.3 ,4 Both developed and developing countries face the obesity epidemic among adults as well as children.5 ,6 The data on obesity and non-communicable diseases in Nepal are limited. In 2013, the WHO STEPwise approach to surveillance (STEPS) survey reported 18% overweight and 4% obesity among the Nepalese adults (15–45 years),7 whereas a population-based study in the Eastern region reported higher prevalence (32.5%) of overweight.8
Diet is one of the most important factors in the development of obesity.9 Despite numerous studies, the nutritional aetiology of obesity remains unclear and controversial, especially in relation to macronutrient composition.10–12 Inconsistent research findings can be attributable to the traditional single-nutrient approach commonly used in nutritional epidemiological research. The traditional approach is limited because of the biological interaction and collinearity between nutrients13 and inability to detect small health effects from single nutrients.14
In response to the limitation of the traditional approach to evaluating food intake, dietary pattern analysis has emerged as a comprehensive alternative or supplemental method to understanding diet–disease relationship.15 The dietary pattern analysis identifies a set of correlated foods and computes a score for each set according to the frequency of intake of the foods. The scores then are used as replacement for the food variables.15 Dietary patterns defined with the use of a dietary index, factor analysis or cluster analysis were previously reported to be associated with obesity in developed countries.16 Several epidemiological studies have reported that dietary patterns high in fruits, vegetables and fibre and low in high-fat dairy products, sweets and processed meat were associated with a reduced risk of obesity.17–19 However, evidence is still limited, and most studies have been conducted in Western populations. The objectives of this study were to identify the major dietary patterns in a suburban community of Nepal and to investigate associations with the prevalence of overweight and obesity measured by BMI among adults participating in the Dhulikhel Heart Study (DHS).
Materials and methods
Study design and participants
This cross-sectional study used data from the first wave of the baseline survey of the DHS. The DHS is a population-based observational cohort study designed to investigate CVD and its conventional risk factors in a suburban Nepalese population in Central Nepal. The study was designed to collect data on all residents aged 18 years and older residing in Dhulikhel (complete ascertainment). All of the households of the city were enumerated (n=2225) and about a third of the households (n=735) were randomly selected, stratified by ward (nine administrative divisions) to represent the first wave of the study. Eligible adult residents living in the sample households were enumerated and contacted during household visits. Eligibility criteria were: being a permanent resident of Dhulikhel, having lived in Dhulikhel for at least 6 months, non-pregnant at the time of data collection and able to communicate in Nepali or Newari language. A total of 1372 eligible participants were enumerated in the first wave of the DHS, out of which the data collectors were able to contact 1103 (80%) participants. Eligible subjects who provided informed consent (n=1073, 78%) were recruited in the study. All subjects provided written informed consent for their participation in the study.
Dietary assessment
We used a Food Frequency Questionnaire (FFQ) for assessing the usual dietary intake. The FFQ contains questions on the average consumption frequency during the past year for 115 commonly consumed food items. Subjects indicated their answers in times per day, per week, per month or per year or as never. The questionnaire was supplemented with colour photographs of four differently sized portions of foods developed by a professional photographer under controlled conditions, including distance, angles, light and presentation. The food items that do not have natural units or applicable household measures were photographed. Different sizes of glasses or bowls were presented to estimate the amount of liquids. Subjects chose one of the amounts presented in the photographs. Other items were asked as a number of specified units (slice, number, spoon, etc).
Food component derivation
We used principal component analysis (PCA) to obtain food patterns reflecting the specific food items consumed.20 From the database, 23 foods and food groups were created according to the macronutrient composition. The food groups and related foods are presented in online supplementary appendix 1. The frequency of food group consumption was entered as the number of servings per week. The PCA was performed using STATA with orthogonal rotation with varimax option to derive optimal non-correlated components (food patterns). The correlation matrix of the standardised variables was examined to decide the number of components to retain based on eigenvalue and interpretability.21
Supplementary appendix
Assessment of obesity and overweight
Weight was measured without shoes and while wearing minimum clothing using an Omron Model HBF-400 Scale and recorded to the nearest 0.1 pounds. Height was measured without shoes using a standard tape measure with participants standing against a wall for measurement and recorded to the nearest 0.1 cm. BMI was calculated as weight in kilograms divided by height in metres squared. Overweight was defined as BMI of 25 kg/m2 or higher and obesity was defined as BMI of 30 kg/m2 or higher based on international cut points.22
Assessment of other variables
Data on physical activity were obtained using a Global Physical Activity Questionnaire,23 included in the participant baseline interview and expressed as the metabolic equivalent of task (MET) minutes per week. A weekly MET equivalent of 600 would be 30 min brisk walking for five times per week or 15 min running for five times per week. Additional covariate information, including age (years), sex (male/female), ethnicity (Newar/Brahmin, Chhetri/other), religion (Hindu/non-Hindu), marital status (married/not married), annual income (converted to US$), education (the number of formal years of education), alcohol consumption (the number of drinks per week) and smoking (pack-years), was self-reported in interviews conducted using standardised questionnaires. Three measurements of systolic and diastolic blood pressures were taken using a Microlife automatic blood pressure measuring device. The mean of the three measurements was used in the analysis (mm Hg). Hypertension was defined as systolic blood pressure 140 mm Hg or greater or diastolic blood pressure 90 mm Hg or greater or taking antihypertensive medication.24
The confounding variables were chosen based on literature review. The variables are defined as confounding when they are associated with both the exposure (dietary intake) and the outcomes (overweight and obesity) and are not in the causal pathway.26
Statistical methods
Sample characteristics were described for men and women using means and SDs for continuous variables and percentages for categorical variables. Our main models used generalised estimating equations (GEE) with multivariate logistic regression, exchangeable working correlation and robust variance. In Nepal, households generally consume food together and eating norms are shared by all of its members. We thus expected that the outcomes among individuals in the same household would be correlated. GEE correct for correlation of responses for participants from a common household (clustered within household), and robust variance estimators provide assurance for valid inference under possibly misspecified correlation structure.27 The food patterns derived using PCA are uncorrelated and were analysed separately in the statistical model with obesity (BMI≥30 kg/m2) and overweight (BMI≥25 kg/m2) as main outcomes. The ORs are reported with 95% CI in the following three hierarchical models for each food pattern: (1) crude OR; (2) OR adjusted for demographic variables (age, sex, ethnicity, religion, marital status, income and education) and (3) OR adjusted for demographic and lifestyle variables (alcohol consumption, smoking, physical activity and systolic blood pressure). We conducted sensitivity analysis by using the servings per week of food groups in each food pattern instead of factor scores as an exposure. We explored the interaction of the derived food patterns scores with age (less than 40 years or 40 years and above) and gender (male/female).
Results
The demographic characteristics of the 446 men and 627 women in the study sample are shown in table 1. The subjects were mean age 40 years and about half of them were of Newar ethnicity. More men were educated and had a higher annual income compared with women.
Demographic characteristics of 1073 community-based Nepalese adults participating in the Dhulikhel Heart Study
The prevalence of traditional risk factors for CVD is presented in table 2. More men were smokers, drinkers and were less physically active compared with women. The prevalence of obesity was higher in women, whereas hypertension was more prevalent among men.
Traditional risk factors for cardiovascular disease in 1073 community-based Nepalese adults participating in the Dhulikhel Heart Study
Based on the eigenvalues and interpretability of the patterns, the PCA revealed four major dietary patterns: the factor loadings of each pattern after orthogonal rotation are shown in table 3. The four factors explained 40% of the variation in the total food intake. The four patterns were labelled based on the food items that loaded highly as follows:
Pattern 1: Mixed pattern (lentils, fruits and vegetables, fatty foods, noodles, tea and coffee)
Pattern 2: Fast food pattern (fast foods, sweets, soda)
Pattern 3: Refined grains–meat–alcohol pattern (refined grains, meat, fish, alcohol)
Pattern 4: Solid fats and dairy pattern (solid fats and dairy)
Score coefficients derived from principal component analysis of foods or food groups consumed by community-based adults participating in the Dhulikhel Heart Study
These patterns accounted for 17.3%, 8.5%, 7.7% and 6.5% of the variation in the food intake, respectively.
Table 4 shows the associations of each of the derived food patterns with sociodemographic characteristics. Younger age was associated with higher score for mixed pattern, fast food pattern and refined grain–alcohol–meat pattern and lower score for sold fats and dairy pattern. Women were less likely to consume more refined grains–meat–alcohol pattern (Coef.=−0.54, SE=0.06, p<0.001), whereas more likely to consume more solid fats and dairy pattern (Coef.=0.19, SE=0.06, p=0.003). Brahmin/Chhetri ethnicity consumed less refined grain–meat–alcohol pattern (Coef.=−0.46, SE=0.08, p<0.001) and more solid fats and dairy pattern (Coef.=0.40, SE=0.08, p<0.001) compared with Newars. Non-married individuals had significantly higher score for fast food pattern compared with married (Coef.=0.42, SE=0.06, p<0.001). Participants with higher education consumed more fast food pattern (Coef.=0.04, SE=0.01, p<0.001) and solid fats and dairy (Coef.=0.03, SE=0.01, p=0.001).
Association of sociodemographic characteristics with the derived food patterns among 1073 participants of the Dhulikhel Heart Study
Table 5 shows the associations of food patterns with prevalence of overweight and obesity. Thirteen participants, who had implausible BMI, were excluded in the present analyses. The refined grain–rice–alcohol pattern was positively associated with overweight. The odds of overweight were 19% higher for those who had a unit higher factor score (OR: 1.19, 95% CI 1.03 to 1.39; p=0.02) after adjusting for demographic and traditional CVD risk factors. There was no significant association between overweight and other food patterns (mixed, fast food, solid fats and dairy). Obesity was not significantly associated with any of the food patterns. The results were similar when we used the number of servings of food groups in each food pattern as the exposure variable instead of the factor score (data not shown).
Association of overweight and obesity with the derived food patterns among 1060 participants of the Dhulikhel Heart Study
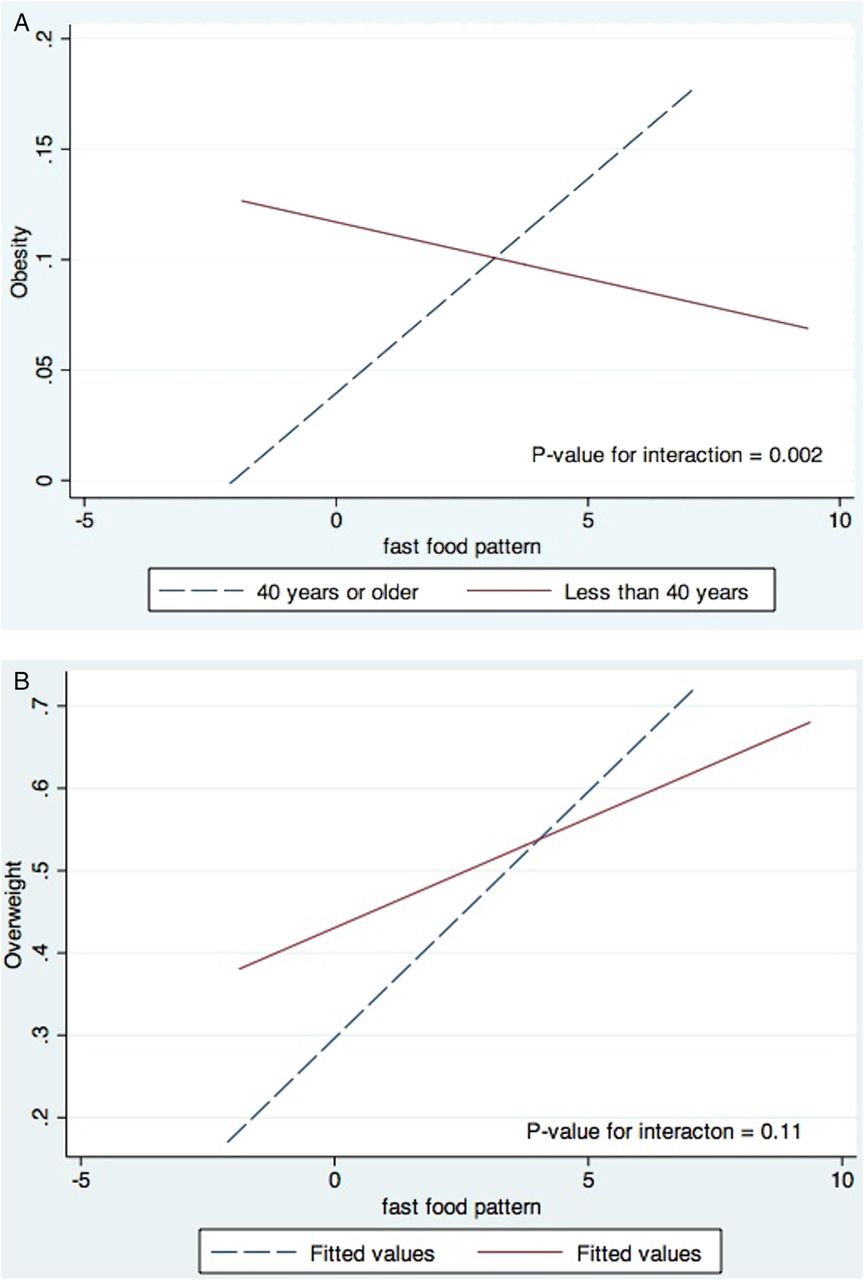
There was a significant interaction between age (less than 40 years or 40 years and above) and fast food pattern in association with obesity (p=0.002) (figure 1). The association of other food patterns with obesity and overweight was not modified significantly by age and sex (not shown). The association of overweight and obesity with the fast food factor stratified by age group is shown in table 6. The odds of obesity were 64% higher for one unit higher of fast food pattern score among those 40 years or older after adjusting for demographic and traditional CVD risk factors (aOR: 1.69, 95% CI 1.19 to 2.39; p value=0.003). The results were similar when we additionally adjusted for other food patterns (not shown).
Association of overweight and obesity with the fast food pattern stratified by age among 1060 participants of the Dhulikhel Heart Study
(A) Interaction between fast food pattern and age (less than 40 years vs 40 years or above) in association with overweight. (B) Interaction between fast food pattern and age (less than 40 years vs 40 or above) in association with obesity.
Discussion
In this study, we sought to identify dietary patterns associated with overweight and obesity in a population-based sample of suburban Nepalese adults. Our findings revealed four major food patterns that characterised the dietary habits of the suburban Nepalese community: mixed pattern, fast food pattern, refined grains–meat–alcohol pattern and solid fats and dairy pattern. Refined grain–meat–alcohol pattern was positively associated with male gender, unmarried status and Newari ethnicity. Individuals characterised as consuming higher amount of refined–meat–alcohol food pattern were more likely to be overweight. Individuals 40 years or older were also more likely to be obese based on higher consumption of fast foods, soda and sweets.
Not surprisingly, our study did not derive the same dietary patterns as other studies, as the diet of the Nepalese differs markedly from that of other populations. Some characteristics of our participants were different according to the dietary pattern. Younger participants had higher score for mixed, refined gain–meat–alcohol and fast food patterns, whereas lower score for solid fats and dairy pattern. Younger people are found to adopt more fast food style food patterns in other studies as well.28 Men had higher score for refined grains–meat–alcohol pattern compared with women. This may be because of the fact that more men were drinkers than women in our population. Similarly, the refined grains–meat–alcohol pattern score was higher for Newars because Newari culture is rich in cuisine, with variety of meat and alcohol.
The differences in the food intake patterns and in the study designs make it difficult to compare results across studies, especially between populations with dietary differences.15 However, distinct dietary patterns reflecting different dietary behaviours have been related to disease rates in other countries.29 Although the refined grains–meat–alcohol pattern was not derived in other studies, the food patterns highly correlated with these food groups have been shown to be associated with obesity in other populations. The refined grain in Nepali diet is predominantly white rice. In a study of Hispanic older adults, a dietary pattern based on rice was positively associated with risk of overall and central obesity.30 Similarly, a traditional Japanese pattern, characterised by high intakes of rice, miso soup and soy products, was reported to be significantly associated with a 1.8-fold increased risk of overweight (BMI≥25 kg/m2) among Japanese women.31 A rice-based dietary pattern was also positively associated with overweight (BMI≥25 kg/m2) in Korean adults.32
Several studies have shown that a meat-based dietary pattern was independently associated with obesity. A pattern characterised by high intake of meat, eggs, fats and oils was related to a higher risk of overweight (BMI≥25 kg/m2) among Japanese women.31 Maskarinec and colleagues33 also identified that a meat pattern characterised by high intake of processed and red meats, fish, poultry, eggs, fats and oils and condiments was positively associated with BMI among Hawaiian women. An alcohol pattern was significantly associated with higher BMI in Swedish women.34 Alcohol may be associated with overweight because of its contribution to high energy intake.35 In our study, the servings per week of red meat and alcohol were independently associated with overweight (data not shown).
Other studies have derived ‘healthy patterns’ comprising fruits, vegetables, lentils and whole cereals, which are associated with lower BMI.36–38 The healthy foods39 such as fruits and vegetables correlated with unhealthy foods like fatty foods40 in our study. The fruits, vegetables and fatty foods are always seasoned with salt in the Nepalese diet and salt intake has been positively associated with obesity.41 The beneficial effect of fruits and vegetables may have been counterbalanced by detrimental effects of fatty foods and salt, resulting in the null association between the mixed pattern and overweight/obesity in our study.
Consumption of fast food and soft drinks in large portion sizes has been found to contribute to the high energy densities and has been attributed to the escalating rates of overweight and obesity in the USA.42–45 In our population, the association between fast food and obesity and overweight was modified by age. There was a positive association of the fast food pattern with obesity and overweight in the older age group (40 years or older), but the association was null in the younger participants. The null association among the younger participants may be due to residual confounding of physical activity and age. It might also be possible that the traditional diet was replaced by fast foods among young adults without major change in total energy consumption, whereas older adults consumed fast foods in addition to the traditional diet.
In our study, while we found a positive association between the refined grains–meat–alcohol pattern and overweight (BMI≥25 kg/m2), the association was not significant when we only looked at obesity as an outcome (BMI≥30 kg/m2). We may not have had enough power to detect the significant association given the sample size and prevalence of obesity (7.7%).46 The association was significant at lower BMI cut-off (≥25 kg/m2). Different BMI cut-off points have been used to identify people with high risk of undesirable health outcomes, especially for Asian population.22 Studies suggest that Asians have a proportionally higher percentage of total body fat and abdominal fat than whites with the same BMI and therefore, obesity-related complications occur at lower BMI.47
One strength of our study is the use of data-driven food pattern analysis. This approach has emerged as a complementary approach to examine diet–disease relationships and is more predictive of disease risk than individual food or nutrients.48 Furthermore, we used advance multivariate analysis to control for different socioeconomic (age, gender, ethnicity, education, marital status, religion and income) and CVD risk factors (smoking, drinking, physical activity and systolic blood pressure).
The current study provides useful information elucidating the associations between dietary patterns and the prevalence of overweight in Nepalese adults. However, several limitations should be considered when interpreting these results. First, our study was cross-sectional, and it is not possible to determine the temporality of variables in this setting. Second, it is very possible that obese people tend to under-report their energy consumption and overestimate healthy foods such as fruits and vegetables,49–51 thus systematically biasing food intake assessment. Third, the PCA method itself has limitations that arise from several subjective choices made in deciding the variable scale, the number of variables, the number of factors and interpretation.48 This may contribute to the inconsistency and limit the ability to generalise results. The anthropometric measurements were performed only once. Hence, we were not able to measure the repeatability and reliability of the measurements. However, trained enumerators using a standard procedure conducted the measurements. We cannot generalise our findings to the entire Nepalese population because Nepal is a multiethnic country with vast diversity in food habits and culture.52 Finally, we were unable to adjust for the role of genetics in our models, which may modify the relationships between diet and overweight.2 ,53 ,54
Conclusion
Our results suggest that higher intake of refined grains–meat–alcohol dietary pattern is associated with increased odds of overweight in suburban Nepalese adults. Fast food intake was associated with higher prevalence of obesity in adults 40 years or older. This study adds to the existing literature by identifying relationships between dietary patterns and overweight/obesity in an understudied population residing in a low-resource setting. Identifying food-based dietary patterns may be useful in dietary counselling and public health efforts at decreasing obesity.
Key messages
What is already known about this subject?
Several epidemiological studies have reported that dietary patterns high in fruits, vegetables and fibre and low in high-fat dairy products, sweets and processed meat were associated with a reduced risk of obesity.
What does this study add?
Our results suggest that higher intake of refined grains–meat–alcohol dietary pattern is associated with increased odds of overweight in suburban Nepalese adults, an understudied population in low-income setting.
How might this impact on clinical practice?
The findings of the study can be used for developing dietary guidelines for prevention of obesity in Nepalese population.
References
Footnotes
Contributors SA conceived of the study. SA, RPK, BMK and ALF initiated the study design and developed data collection tool for outcome and other variables measurement. SA, ALF and SAAB developed data collection tool for exposure measurement. SA trained data collectors. RPK oversaw the data collection in the field. SA conducted data analysis and wrote manuscript. ALF, CGCK and SAAB provided significant input for data analysis. All authors contributed to refinement and approved the final manuscript.
Disclaimer This work has been published online as part of a PhD thesis.
Competing interests None declared.
Ethics approval Institutional review boards at University of Washington and Nepal Health Research Council.
Provenance and peer review Not commissioned; externally peer reviewed.
Data sharing statement The proposed research includes data from 1073 residents of Dhulikhel town in Central Nepal. The data set includes self-reported demographic and behavioural data from interviews, anthropometric and blood pressure measurements from the 1073 subjects and laboratory measurements (HbA1C, lipid profile, sugar) from 539 subjects. The final data set is de-identified. We will make the data and associated documents available to users under a data sharing agreement that provides for: (1) a commitment to using the data only for a research purpose; (2) a commitment to securing the data using appropriate computer technology; (3) a commitment to destroying or returning the data after analyses are completed and (4) presenting an approval from a proper ethical review board. The data will be available to the researchers who present a well-written scientific proposal. The proposal needs to reviewed and approved by the research advisory board at the Kathmandu University, Nepal. The approved proposals will be provided with data via an electronic media: email or in an external drive.
Linked Articles
- Correction