Article Text

Abstract
Objectives The burden of coronary artery disease (CAD) has increased in the last three decades in low-income and middle-income countries including India. CAD is responsible for 20% deaths in India. The burden of CAD has increased due to a higher prevalence of risk factors related to the changing lifestyle. We studied the change in prevalence of CAD and risk factors over 20 years in a rural area.
Methods A rural population of adults over the age of 30 years from three villages of Punjab was surveyed for the prevalence of CAD and its risk factors in 1994 and 2014 using similar research methodology. CAD was diagnosed by Epstein and clinical criteria. Blood pressure, anthropometry, ECG and biochemical analysis were carried out. The findings of two surveys were compared with a look at the change in the prevalence of CAD and its risk factors over 20 years.
Results The overall age standardised prevalence of CAD increased from 2.79% in 1994 to 4.06% (p<0.05) in 2014. There was a significant increase in the prevalence of several risk factors including sedentary lifestyle (8.2% vs 41.3%, p<0.001), hypertension (14.5% vs 26.5%, p<0.001), diabetes (4.7% vs 9.7%, p<0.001), obesity (16.6% vs 35.4, p<0.001) and hypercholesterolaemia (7% vs 9.6%, p 0.011). In contrast, cigarette smoking (8.9% vs 3%, p<0.001) and use of desi ghee (51.4% vs 28.5%, p<0.001) decreased.
Conclusions In a rural population of Punjab, the prevalence of several CAD risk factors like sedentary lifestyle, hypertension, diabetes, obesity and hypercholesterolaemia increased over 20 years. These changes in risk factors were associated with a modest increase in prevalence of CAD.
- coronary artery disease
- epidemiology
- prevalence
- risk factors
- rural India
Statistics from Altmetric.com
Introduction
Coronary artery disease (CAD) is one of the most common causes of morbidity and mortality in both low-income/middle-income and developed countries.1–4 Cardiovascular diseases led to more than 17.5 million deaths in year 2012 globally.1 About 80% of these deaths occurred in low-income/middle-income countries. According to a WHO report in 2014, the age-adjusted cardiovascular disease mortality rates in India were 349 and 265 per 100 000 in men and women, respectively. These rates are more than two to three times higher than in USA (170 and 108 per 100 000 in men and women, respectively).1 The reasons for higher cardiovascular mortality in low-income/middle-income countries are not very well known. Although the risk factor burden in these countries has increased over the past few decades, it is still lower than high-income countries. It may be that the cardiovascular mortality rates are lower in high-income countries due to better control of risk factors, better assess to proven pharmacological therapies and revascularisation.2
The prevalence of CAD has increased in India as shown in many studies conducted in rural and urban India over the last 30 years.5–12 The National Statistical Survey Organisation (NSSO) survey is the largest recent study on the prevalence of CAD in India. In its 60th NSSO survey (2004–2005), a total of 390 913 subjects were evaluated. The prevalence of CAD was found to be 7% in urban and 3% in the rural population.10
The increase in CAD prevalence in India is attributed to social and economic change and its consequences including change in dietary habits, physical inactivity and increased incidence of diabetes and hypertension. Increase in prevalence may also be due to, although small, better survival on account of early detection and treatment. Although many studies from India have reported a trend towards increase in prevalence of CAD, most of these studies only report the prevalence of CAD and risk factors at one time point.5–8 One study from urban India that looked at trend in changes in the prevalence of risk factors found that over a 20-year period, body mass index (BMI) and overweight increased, smoking and systolic blood pressure (BP) decreased, while truncal obesity, hypercholesterolaemia and diabetes remained unchanged.13
We report changes in the prevalence of CAD and its risk factors over a period of 20 years in a rural community of Punjab. To the best of our knowledge, this is the first such study from rural India that has investigated the same area 20 years apart.
Materials and methods
We performed a cross-sectional epidemiological study in the native and non-migrant rural population of three villages—Pohir, Lehra and Khera—of Dehlon Block of Ludhiana District, Punjab, India, in the year 1994. These villages are the field practice areas of Rural Health and Training Centre (RHTC) located at the village of Pohir, Block Dehlon, District Ludhiana, Punjab India. This centre is an integral part of the Department of Community Medicine, Dayanand Medical College & Hospital, Ludhiana. The entire population of this rural area is closely monitored by multipurpose health workers who provide home-based comprehensive healthcare. A folder for each family is maintained and regularly updated at the RHTC, which includes details of each family member on an individual card. There are adequate demographic and health surveillance data of families of the studied villages. All the subjects with age more than 30 years were included and a door-to-door survey was carried out. The results of the study have been published.7 In 2014, an identical cross-sectional epidemiological survey was carried out in the same rural area using similar research methodology. The primary objective of the 2014 survey was to examine the changes in the prevalence of CAD and its risk factors over the past 20 years.
The total population of the three villages had increased significantly from 4962 to 6046 and so had those over the age of 30 years.
Due to better resources, a larger percentage of population could be evaluated in 2014 as compared with 1994 (table 1). The survey methods for the evaluation of risk factors and CAD in 2014 were similar to those in 1994, although some criteria have changed. A comparison of the methods used in the two surveys is given in table 1.
Comparison of study methods
Study population
All persons aged 30 years and above were included in both the surveys. The population of these villages comprises people from upper-income, middle-income as well as low-income group. The demographic characteristics of age, gender, religion (Hindu/Sikh/Muslim/others), caste (non-scheduled/scheduled/others), education (uneducated/primary level/middle level/secondary level/graduates and above) and use of alcohol were recorded. The dietary habits, smoking and type of cooking medium (desi ghee/dalda ghee/refined oil) used were recorded. Smokers were defined as those who were smoking one or more cigarette per day for at least 1 year. Both current and ex-smokers were included. Physical activity was graded into three groups—heavy, medium and light activity—as suggested by Dewan et al. 14
Anthropometric measurements
Anthropometric measurements (height and weight) were recorded and BMI was calculated. In the 2014 survey normal BMI was taken as 18.0–22.9 kg/m2, overweight if BMI was between 23.0 and 24.9 kg/m2, and obese if BMI ≥25 kg/m2 as per consensus statement in the 2014 survey.15 In the 1994 survey men with BMI >27 and women with BMI >25 were taken as obese. For comparison, values have been given according to the earlier criteria (1994) of BMI in the comparative chart for both the surveys.
BP measurement
BP of all participants was recorded in the sitting position using calibrated sphygmomanometer by a physician. Two readings were taken 5 min apart and the mean of the two was considered as the BP measurement. Classification of BP was done according to the WHO Expert Committee Guidelines in 199416 and Indian Hypertension Guidelines (2013) in 2014.17 Same cut-off of 140/90 was taken for definition of hypertension in both surveys.
Biochemical investigations
Blood samples were collected in non-fasting state for measurement of serum cholesterol from those subjects who consented for this investigation, and were available in 790 (72%) subjects in 1994 and 2532 (93%) in 2014. Blood samples for total cholesterol measurement were transported on ice (4°C–6°C) packs and thermocol boxes to the biochemistry department, where samples were analysed using cobas 6000 (Roche) autoanalyser within 24 hours of sample collection. Hypercholesterolaemia was defined according to the National Cholesterol Education Program Adult Treatment Panel III criteria.18 Values <5.18 mmol/L (200 mg/dL) were considered normal while values between 5.18–6.19 mmol/L (200–239 mg/dL) and ≥6.20 mmol/L (240 mg/dL) were considered to be borderline high and high, respectively. In 1994, the American Heart Association guidelines were used and individuals were grouped as moderate risk (5.69–6.20 mmol/L (220–240 mg/dL)) and high risk (>6.20 mmol/L (>240 mg/dL)).19 For comparison, the same value of >240 was used for hypercholesterolaemia.
Diabetes was defined as individuals known to have the disease or those with a random venous blood glucose level >10 mmol/L (180 mg/dL) in the 1994 survey. In the 2014 survey, random capillary blood glucose concentration ≥11.1 mmol/L (200 mg/dL) was used as cut-off to define diabetes, which corresponds to venous blood glucose level of 10 mmol/L as per WHO criteria.20 Blood glucose levels were available in 809 subjects (73.55%) in 1994 and in all 2732 (100%) in 2014.
ECG and CAD criteria
A resting 12 lead ECG was done for all the study subjects. All the recorded ECGs were coded using the Minnesota code by a physician and confirmed by a cardiologist. For diagnosis of CAD, we used both ECG-based criteria (Epstein criteria)21 as well as clinical criteria (known CAD). Only Epstein’s probable cases were considered positive for CAD. The ‘suspect’ cases were excluded.
Epstein’s probable cases included the following:
Class I: persons with probable angina pectoris or ECG evidence of:
Q wave changes (Minnesota code category I1 and I2)
complete heart block (Minnesota code category VI1)
complete left bundle-branch block (Minnesota code category VII1) or both.
Class II:
a probable history of myocardial infarction without residual Q wave changes
frankly inverted T waves (Minnesota code category V1 and V2) but without evidence of left ventricular hypertrophy (Minnesota code III1)
ST depression of 1 mm or more (Minnesota code category IV1).
Patients with known CAD included those who had documented evidence of acute coronary syndrome, treatment for CAD including history of angioplasty/Coronary Artery Bypass Graft Surgery (CABG) or documentation of CAD by coronary angiography.
The study was approved by the institutional ethics committee. A written informed consent was obtained from all participants in the study.
Statistical analysis
Data have been expressed as frequency (%) for qualitative variables. Fisher’s Z test was applied for comparison of proportions. p<0.05 was taken as a level of statistical significance. Age standardisation of two surveys was done by direct method, and rural Indian census 2011 population was taken as standard reference population. The annual percentage change of CAD prevalence and risk factors was calculated using the formula ((F/I)[1/time]− 1)×100, where F is the final prevalence rate and I is the initial prevalence rate. All the data were recorded on Microsoft Excel database and statistical analysis was done using SPSS V.20.0.
Results
In the 1994 survey, the three villages had a total population of 4962, out of which 1617 (32.6 %) were older than 30 years. A total of 1100 of these subjects (68% of eligible subjects) could be evaluated for most of the measurements including ECG. In 2014, the population of these three villages had increased to 6046, with 2957 (48.9 %) of them older than 30 years and 2732 subjects (92.4%) were evaluated for most risk factors including blood glucose and cholesterol. The number in the second survey is higher due to three factors: the total population has increased, the percentage population more than 30 years is higher, possibly due to improved longevity, and also much higher percentage of the eligible population (92.4% vs 68%) could be evaluated due to better resources available with us.
The demographic profile of the populations in the two surveys is shown in table 2. There was significant increase in elderly population (age >70 years) in 2014 as compared with 1994 (8.9% vs 6.2%, respectively, p<0.005). The religion wise distribution of the three communities was almost similar. There was an improvement in the level of education, and significantly less individuals were uneducated and more had secondary and graduate-level education in 2014 compared with 1994.
Comparison of demographic profile
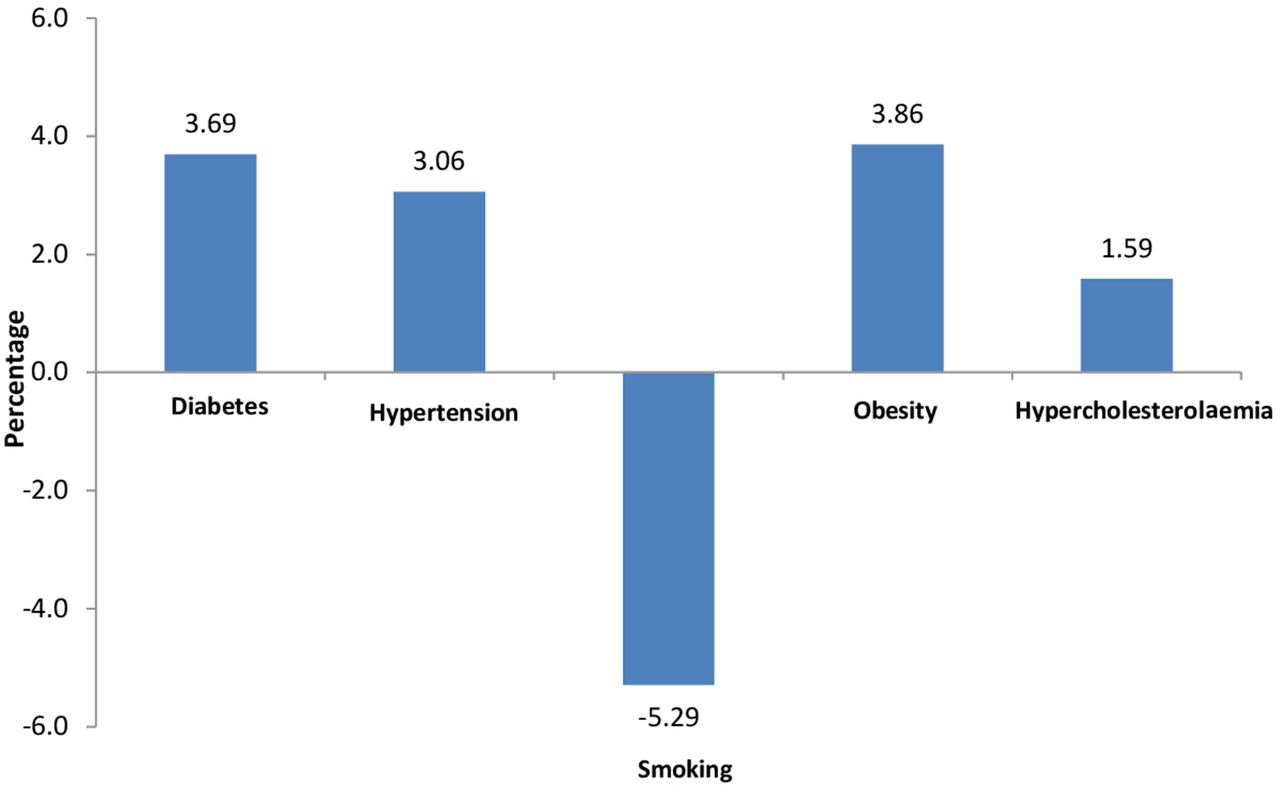
The prevalence of risk factors in the two surveys is shown in figure 1. There was a significant increase in the prevalence of several risk factors in 2014, including diabetes, hypertension, obesity, sedentary activity (figure 1B) and hypercholesterolaemia. However, the prevalence of smoking decreased significantly, whereas the use of the refined vegetable oil increased and the use of saturated fat such as desi ghee decreased. There was a small increase in the use of saturated vegetable fat as dalda ghee (figure 1C). The annual percentage change in various risk factors is shown in figure 2.
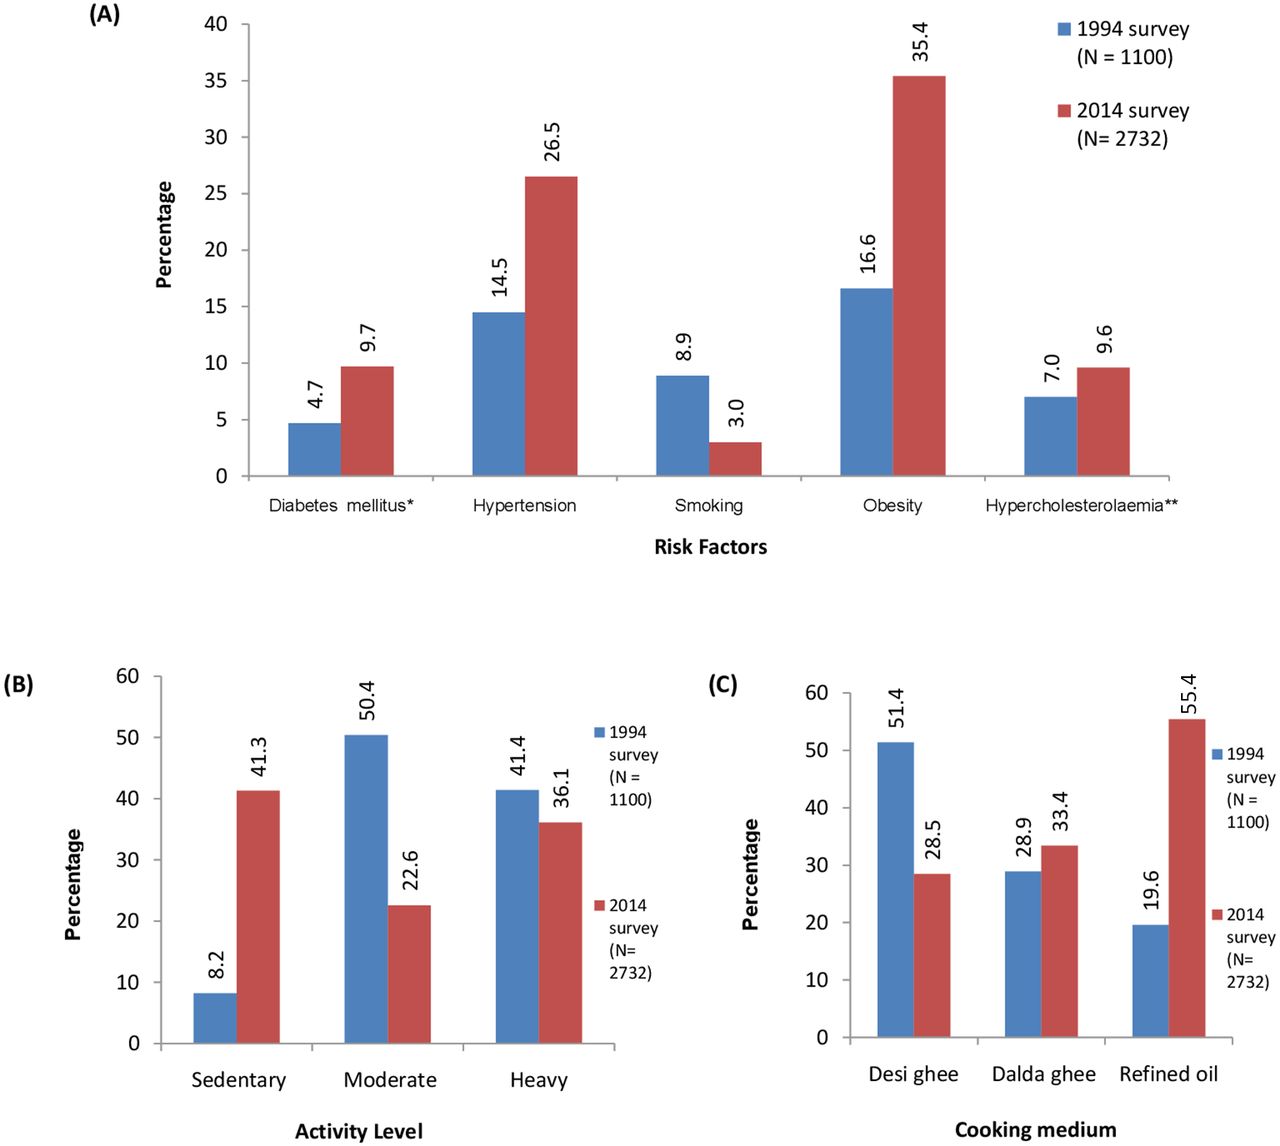
Comparison of various risk factors (A), cooking medium (B) and activity level (C) between two surveys (p value was significant (<0.05) for comparison of all the risk factors, activity level and cooking medium). *809 samples were available in year 1994. **790 samples were available in year 1994 and 2532 in year 2014.

Annual percentage change in risk factors.
The overall age standardised prevalence of CAD increased significantly to 4.06% in 2014 from 2.79% in 1994 (p<0.05) (table 3) (see online supplementary figure 1). There was a steady increase in CAD prevalence in all age group above 40 years. The overall age standardised CAD prevalence increased significantly among men from 1994 to 2014 (4.04% in 2014 vs 2.28% in 1994, p<0.05). However in women, there was marginal increase in overall age standardised CAD prevalence (4.06% in 2014 vs 3.76% in 1994, p>0.05). The annual percentage increase in CAD prevalence was 1.87% overall, with 2.90% in men and 0.38% in women, respectively.
Supplementary file 1
Age-adjusted prevalence of CAD (%)*
Discussion
CAD has assumed epidemic proportions in India.1 Increasing life expectancy, socioeconomic development and changing lifestyle during the recent years have increased the prevalence of cardiovascular risk factors and consequently CAD even in rural India.6–12 In the present study, we report the changes in the prevalence of CAD and its risk factors from a rural population of three villages in Punjab over a period of 20 years.
Several studies from rural areas suggest increase in the prevalence of CAD. However, none of these studies examined the population residing in the same area after 20 years.6–12 Our study is unique, since for the first time the same area in rural India has been surveyed for trends in prevalence of CAD and risk factors.
Change in prevalence of CAD
The overall age standardised CAD prevalence was 4.06% in 2014, which is significantly higher than in 1994 (2.79%). There are one time prevalence studies available from rural India looking at the prevalence of CAD. Some of the earlier studies (1974–1994) have reported a prevalence of 2.06%–3.53%, which is less than our 2014 survey.5–8 Recent studies by Joshi et al 9 and Krishnan et al 22 have reported a prevalence of 4.8% and 3.57%, respectively. The only other study from rural India that has looked at the change in the prevalence of CAD over 20 years found an increase in prevalence among women with no increase among men.23 However, their study was restricted to subjects with age group between 30 and 60 years only, whereas we included all individuals with age more than 30 years. Also, change in risk factors over 20 years was not evaluated. In our study, there was a significant increase in the prevalence of CAD among men. There was a marginal increase in CAD prevalence among women, although this was statistically non-significant.
Thus the prevalence of CAD has increased considerably over the past two decades in rural India. These findings suggest that the rural population is also undergoing lifestyle transition due to socioeconomic growth and is adopting urban lifestyle without migrating to urban areas.
Change in prevalence of risk factor
The change in prevalence of CAD was associated with significant increase in the prevalence of most CAD risk factors over the past two decades. Diabetes, hypertension, obesity, sedentary lifestyle and hypercholesterolaemia increased significantly over the last 20 years. In fact the prevalence of risk factors in rural India is now approaching the rates seen in urban subjects. However, with the improvement in education status and awareness of harmful effects of smoking and use of saturated fat, there is a decrease in prevalence of smoking and use of desi ghee as a cooking medium. This is significant because the Punjabi population, especially in the rural areas, have traditionally used desi ghee with high saturated fat content as a cooking medium for many years.
Several reports are available that show rising trends in prevalence of diabetes in rural population. The prevalence of diabetes has more than quadrupled in the last 20 years from 1%–3% to 10%–15% in urban areas and 3%–5% in rural areas.24 In our study prevalence of diabetes has also increased by more than twofold in the past 20 years. Likewise the prevalence of hypertension in our population has increased from 14.5% to 26.5% over the past 20 years, which is consistent with the trends reported from other rural areas of the country. Various hypertension epidemiology studies conducted over the past 20 years (1995–2015) show that hypertension prevalence has rapidly increased from 10%–12% to 22%–25% in rural areas, while it has remained stable (28%–32%) in urban population resulting in a phenomenon of urban rural convergence.11 25
Recent surveys from India have reported a higher prevalence of obesity (20%–31.3%).11 26 In the current study, the prevalence of overweight and obesity was higher than most other studies from India, even from the urban areas.
The Global Burden of Metabolic Risk Factors of Chronic Diseases Collaborating Group reported international trends in BMI, BP and cholesterol levels collating cross-sectional data from more than 190 countries and millions of subjects over a 35-year period.27–29 There was a significant heterogeneity in levels of risk factors across the globe. Mean BMI increased in all parts of the world (high-income, middle-income and low-income countries), but the increase was steepest in middle-income countries and least in low-income countries. Mean systolic BP declined sharply in high-income countries, declined marginally in middle-income countries and increased significantly in low-income countries. Mean cholesterol levels declined in high-income countries but remained almost stable in low-income countries. Our results are likely to be similar to those observed in low-middle income countries. The World Bank has also recently reclassified India from low-income to lower middle-income group.30 There are limited population-based studies available from low-income to middle-income countries especially rural areas that have evaluated the risk factor trends.
The limitations of this study are that the population coverage attained in 1994 was low (68%). The rest of the subjects were either not available at home or they denied consent to participate in the study. Due to low coverage in 1994, selection bias cannot be entirely excluded. In 2014 similar research methodology was used that allows measurement of change in CAD and its risk factors after 20 years in the same rural area of Punjab. This is the strength of our study since a 20-year change of risk factor in the same area has not been previously reported from rural India. It is ideal to use random sampling method and cover a large population. We did not use random sampling method and sampling was restricted to three villages under the field practice areas of the Department of Community Medicine due to scarcity of resources and manpower, which is another limitation of our study. Also, blood samples for blood sugar analysis were available in 73.54% in 1994 and for cholesterol analysis were available in 71.81% in 1994 and 92.68% in 2014, respectively.
Conclusion
The present study is the first study from rural India that has evaluated change in CAD risk factor profile in the same area over 20 years. These findings suggest that the prevalence of CAD and risk factors is increasing even in the rural population of India. Larger studies from various parts of country are needed to clarify this issue further. These findings also call for aggressive strategies to prevent and control coronary risk factors. Preventive strategies targeted to reduce the burden of CAD risk factors need to be adopted by community-based interventions. A recent study from a low-income rural community from USA has shown that organised community preventive efforts integrated with primary healthcare result in better control of risk factors.31 We need to recognise that CAD risk factors are increasing in rural India and the need to adopt appropriate measures to reduce the increasing cardiovascular disease burden in India.
Key messages
What is already known about this subject?
Various epidemiological studies have reported one time prevalence of coronary artery disease (CAD) and its associated risk factors in low-income countries.
What does this study add?
This study shows that CAD prevalence has significantly increased in rural India over 20 years. There is also a significant increase in risk factors such as sedentary lifestyle, hypertension, diabetes, obesity and hypercholesterolaemia in the same area over a span of 20 years.
How might this impact on clinical practice?
The findings of this study call for developing strategies for addressing the increase in CAD prevalence and its associated risk factors in rural area especially at the primary healthcare level.
References
Footnotes
Contributors RG was involved in conducting the 1994 survey as a postgraduate student. PK was involved in conducting the 2014 survey as a postgraduate student. ISA guided the two surveys and helped in writing the article and in data interpretation. RKS was involved in data collection, analysis and interpretation. STC, NA and BM were involved in collection of data in 2014 survey and in the interpretation of data. AG was involved in interpretation of data for comparison of the two surveys and in interpretation and writing of the article. DJ was involved in planning of 2014 survey and in interpretation of the data. VP was involved in data analysis, interpretation and in writing the article. GSW was involved in planning, execution and analysis of the two surveys and in writing the article.
Funding Institutional Research Fund.
Competing interests None declared.
Ethics approval Institutional Ethics Committee.
Provenance and peer review Not commissioned; externally peer reviewed.