The Lag Effects and Vulnerabilities of Temperature Effects on Cardiovascular Disease Mortality in a Subtropical Climate Zone in China

Abstract
:1. Introduction
2. Material and Methods
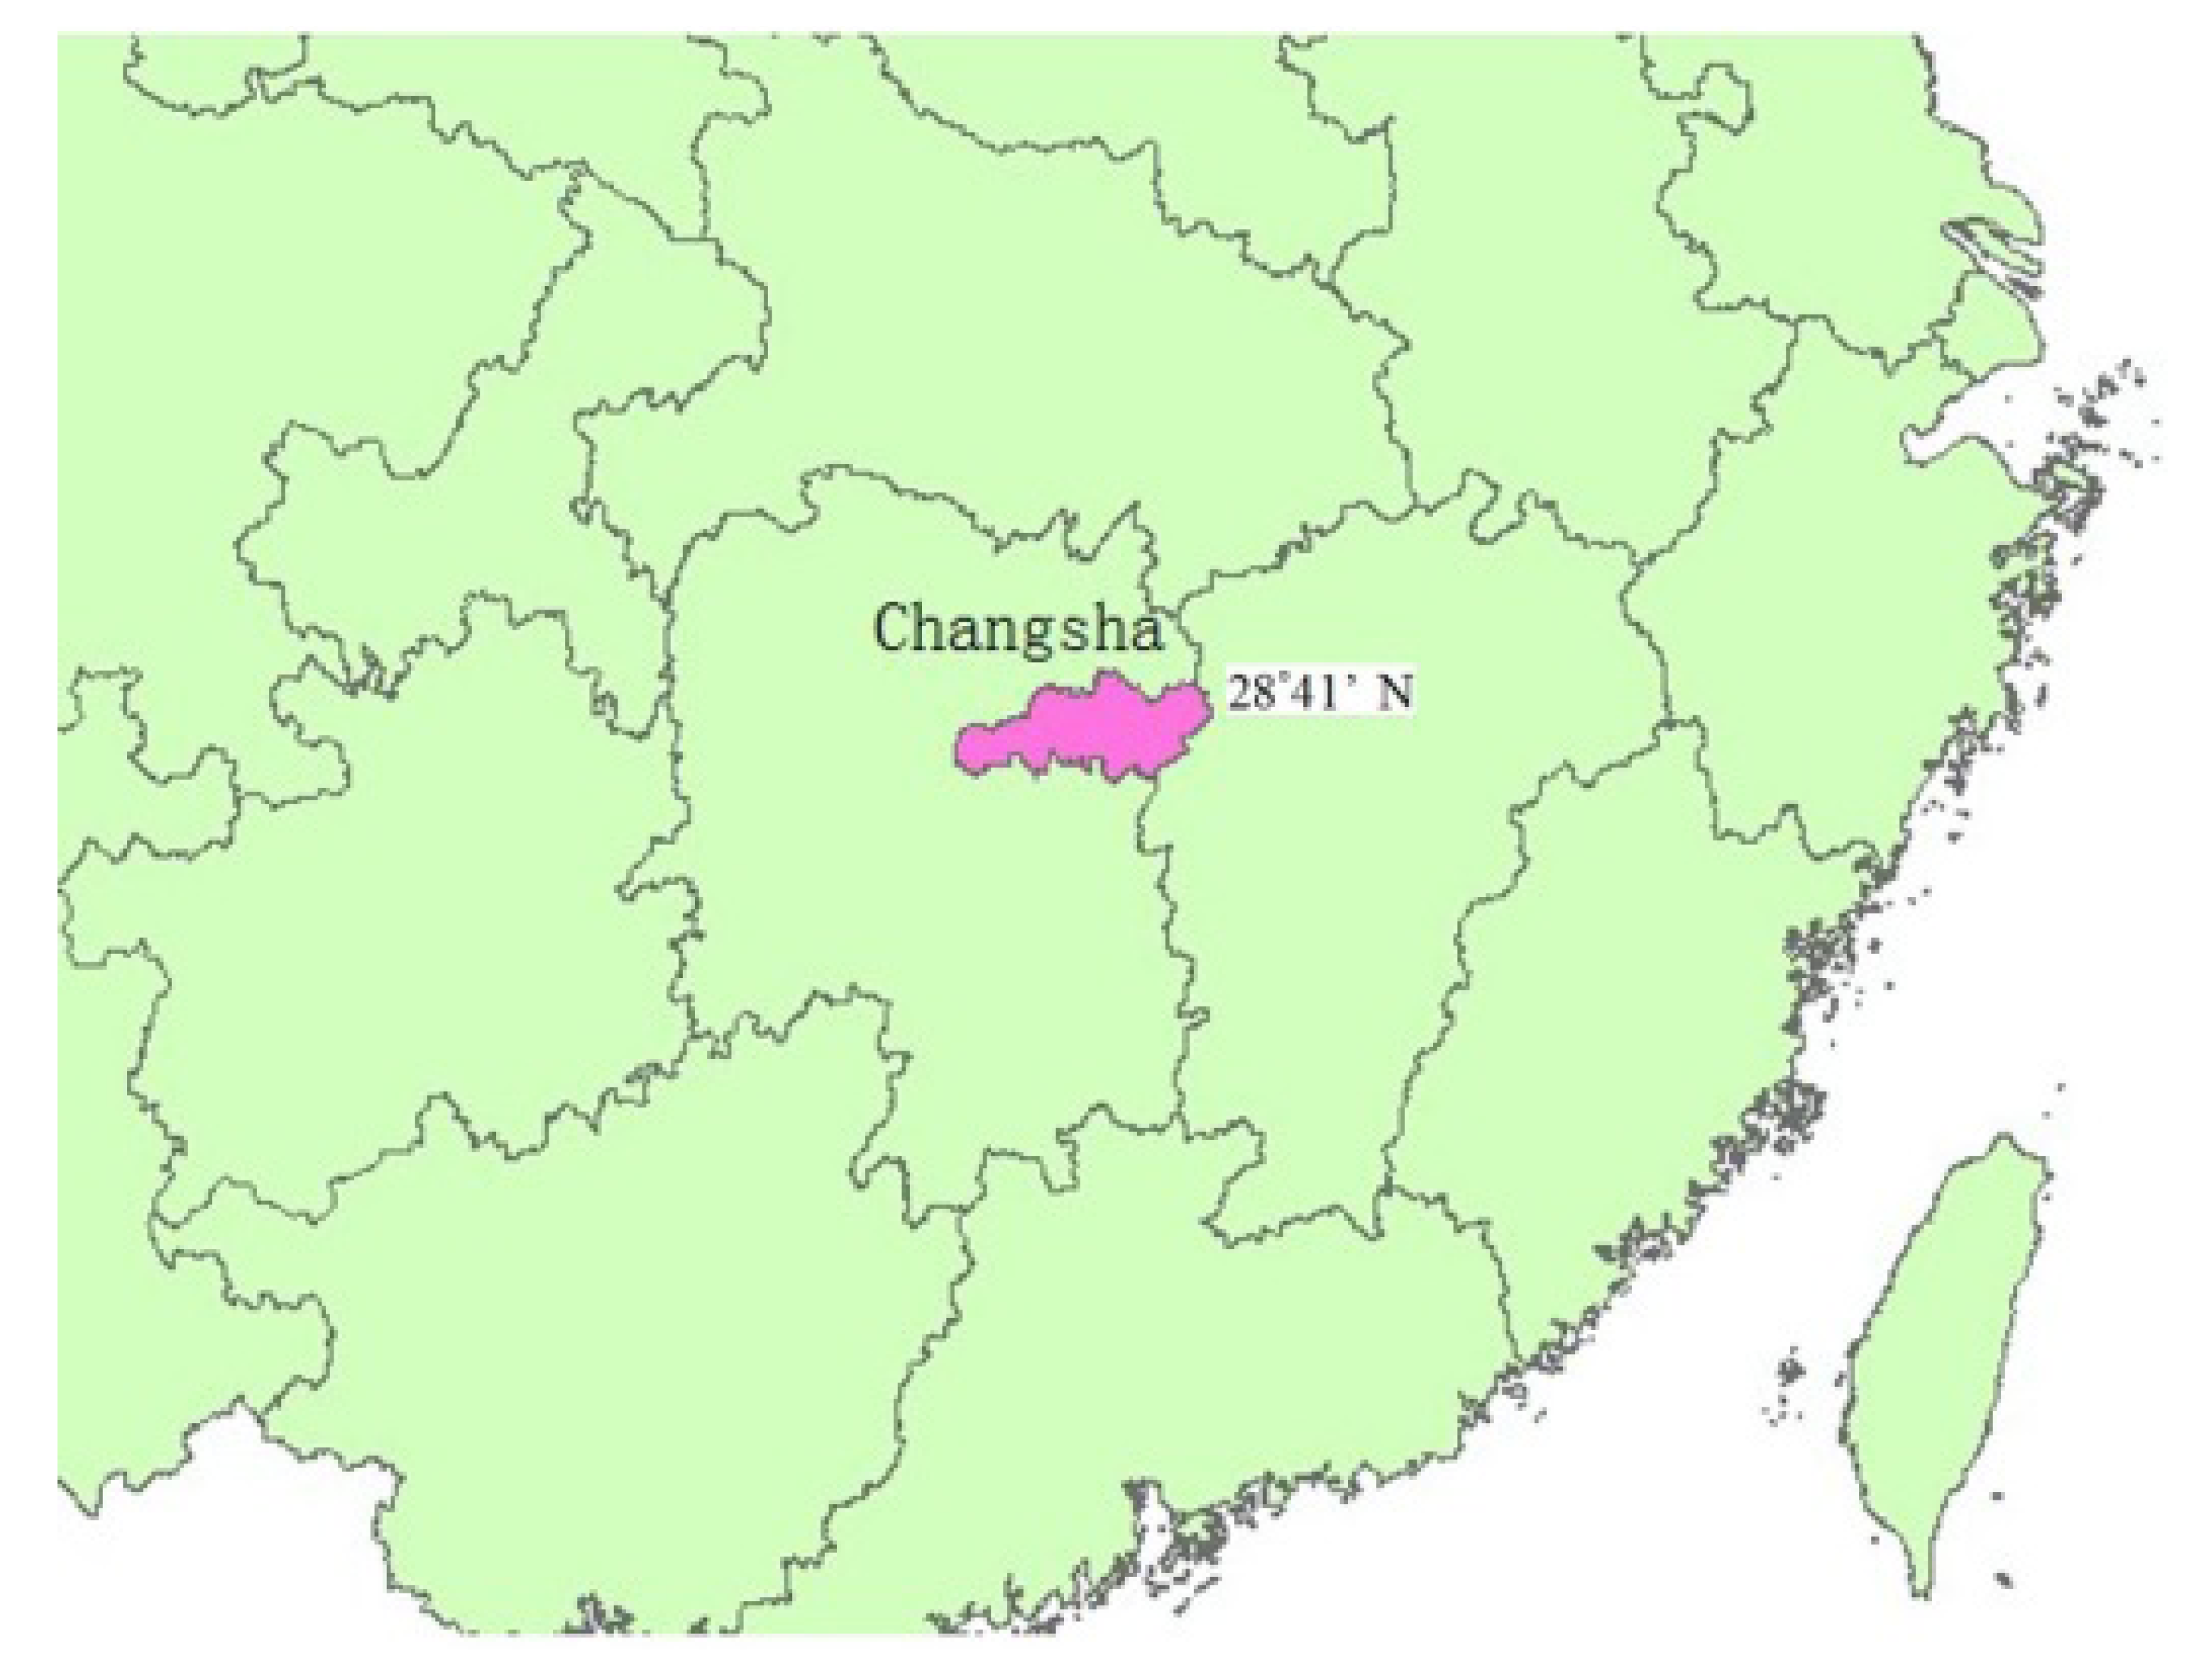
2.1. Study Area

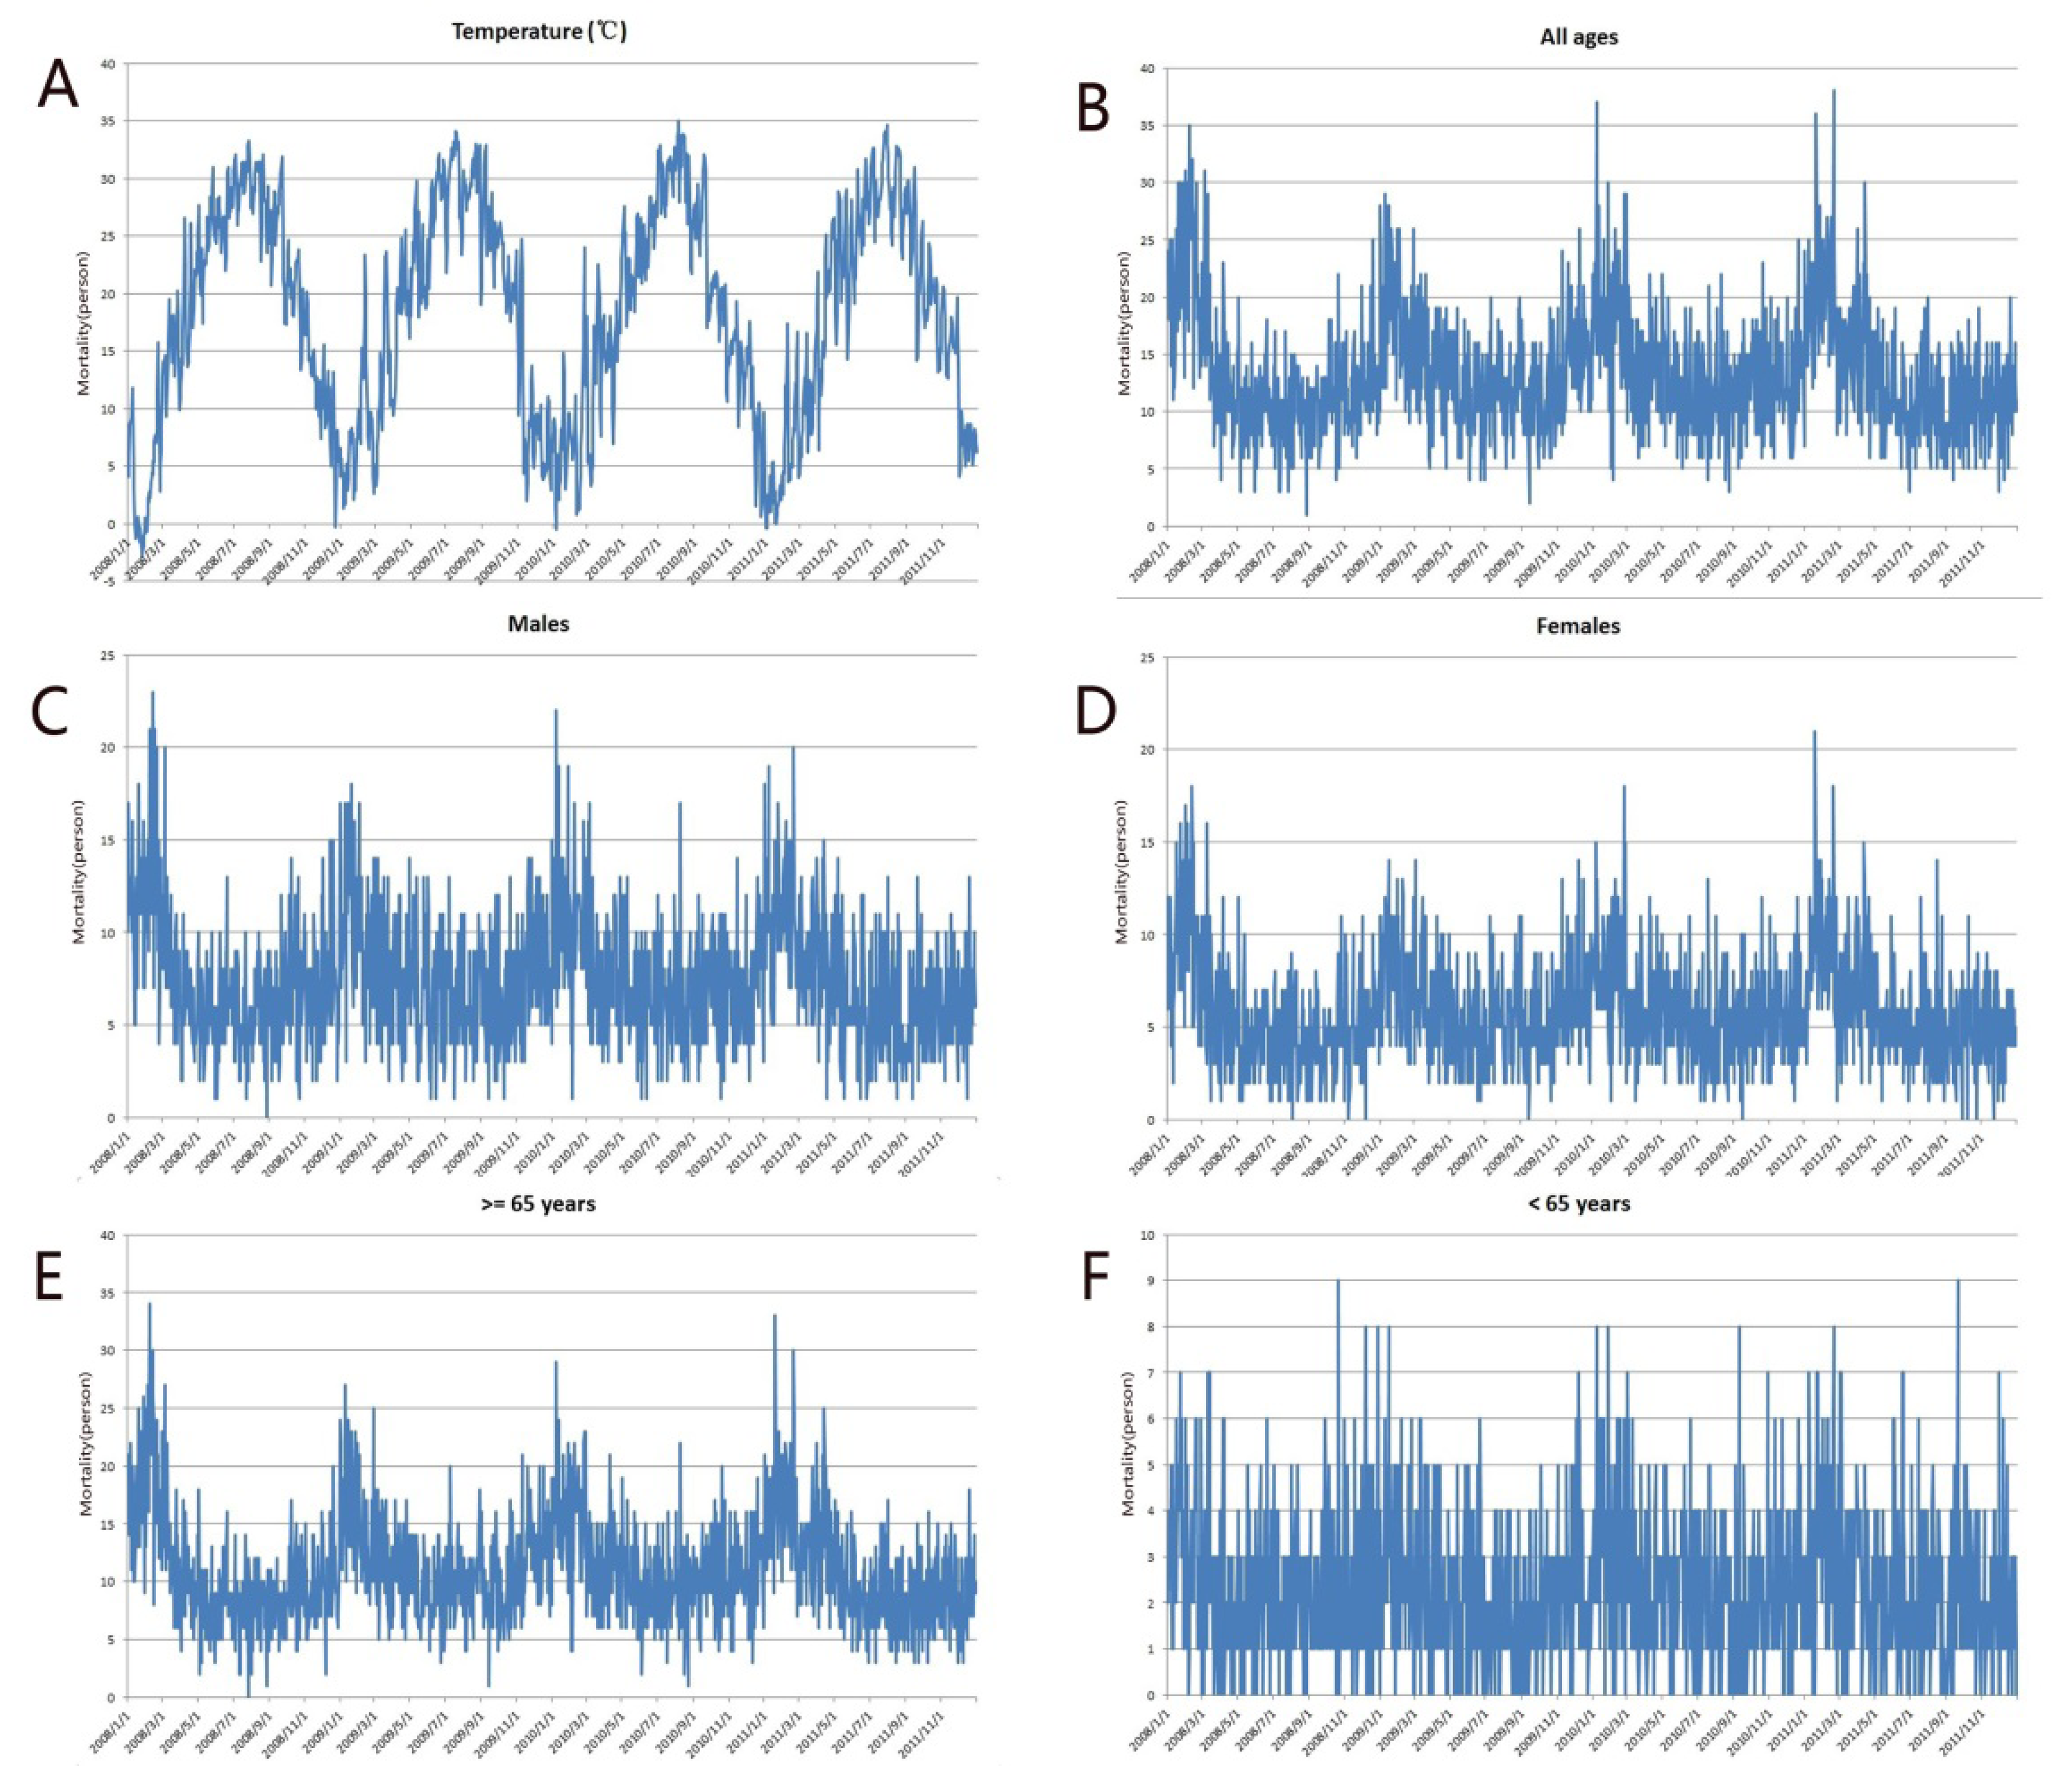
2.2. Mortality Data
2.3. Meteorological and Air Pollution Data
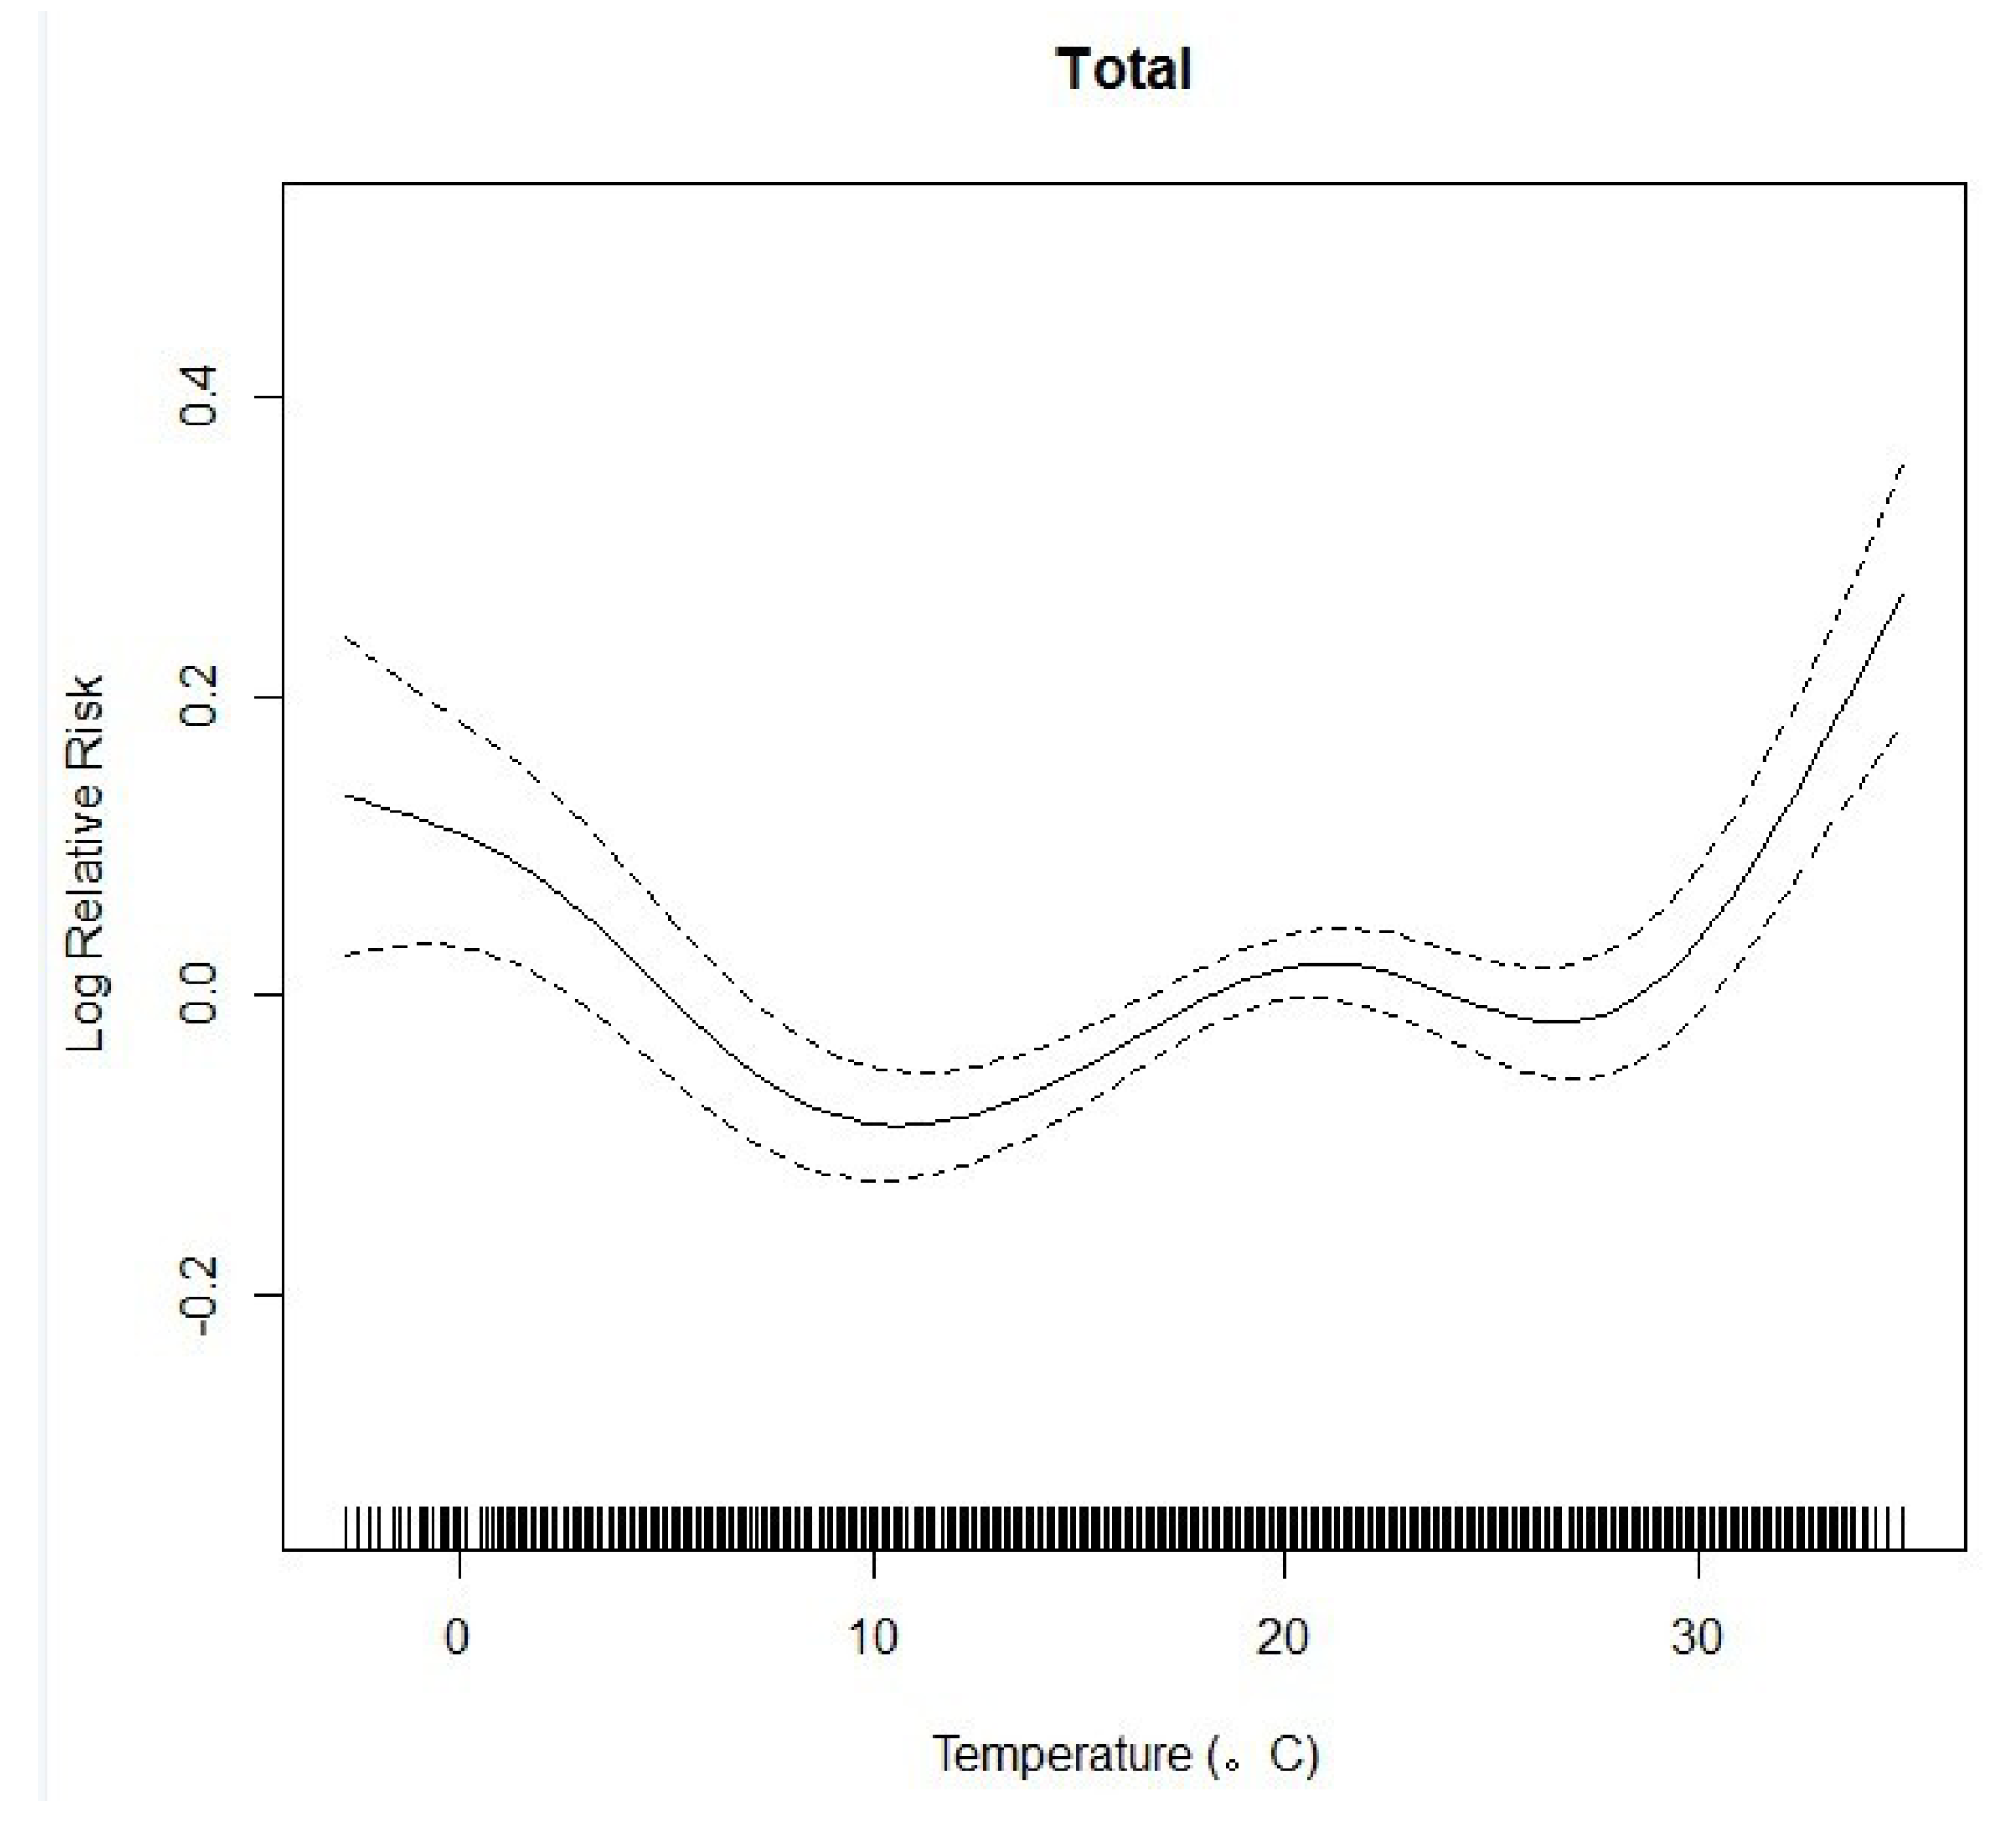
2.4. Statistical Analyses

2.5. Sensitivity Analyses
3. Results


| Percentile | ||||||
|---|---|---|---|---|---|---|
| Mean(SD) | Minimum | 25% | 50% | 75% | Maximum | |
| CVD All ages | 13.3 | 1 | 10 | 12 | 16 | 38 |
| CVD 65+ | 11.0 | 0 | 8 | 10 | 13 | 34 |
| CVD 65− | 2.3 | 0 | 1 | 2 | 3 | 9 |
| CVD Male | 7.5 | 0 | 5 | 7 | 10 | 23 |
| CVD Female | 5.8 | 0 | 4 | 5 | 7 | 21 |
| API | 68.7 | 11 | 53 | 67 | 82 | 443 |
| AT | 18.3 | −2.8 | 10.1 | 19.2 | 26.4 | 35 |
| MaxTemp | 22.6 | −2.1 | 14.9 | 23.4 | 31.2 | 40.7 |
| MinTemp | 15.0 | −5.3 | 7.2 | 16.3 | 23 | 30.7 |
| RH | 74.8 | 29 | 66 | 76 | 85 | 97 |
| Wind | 2.0 | 0.4 | 1.4 | 1.9 | 2.5 | 5.7 |

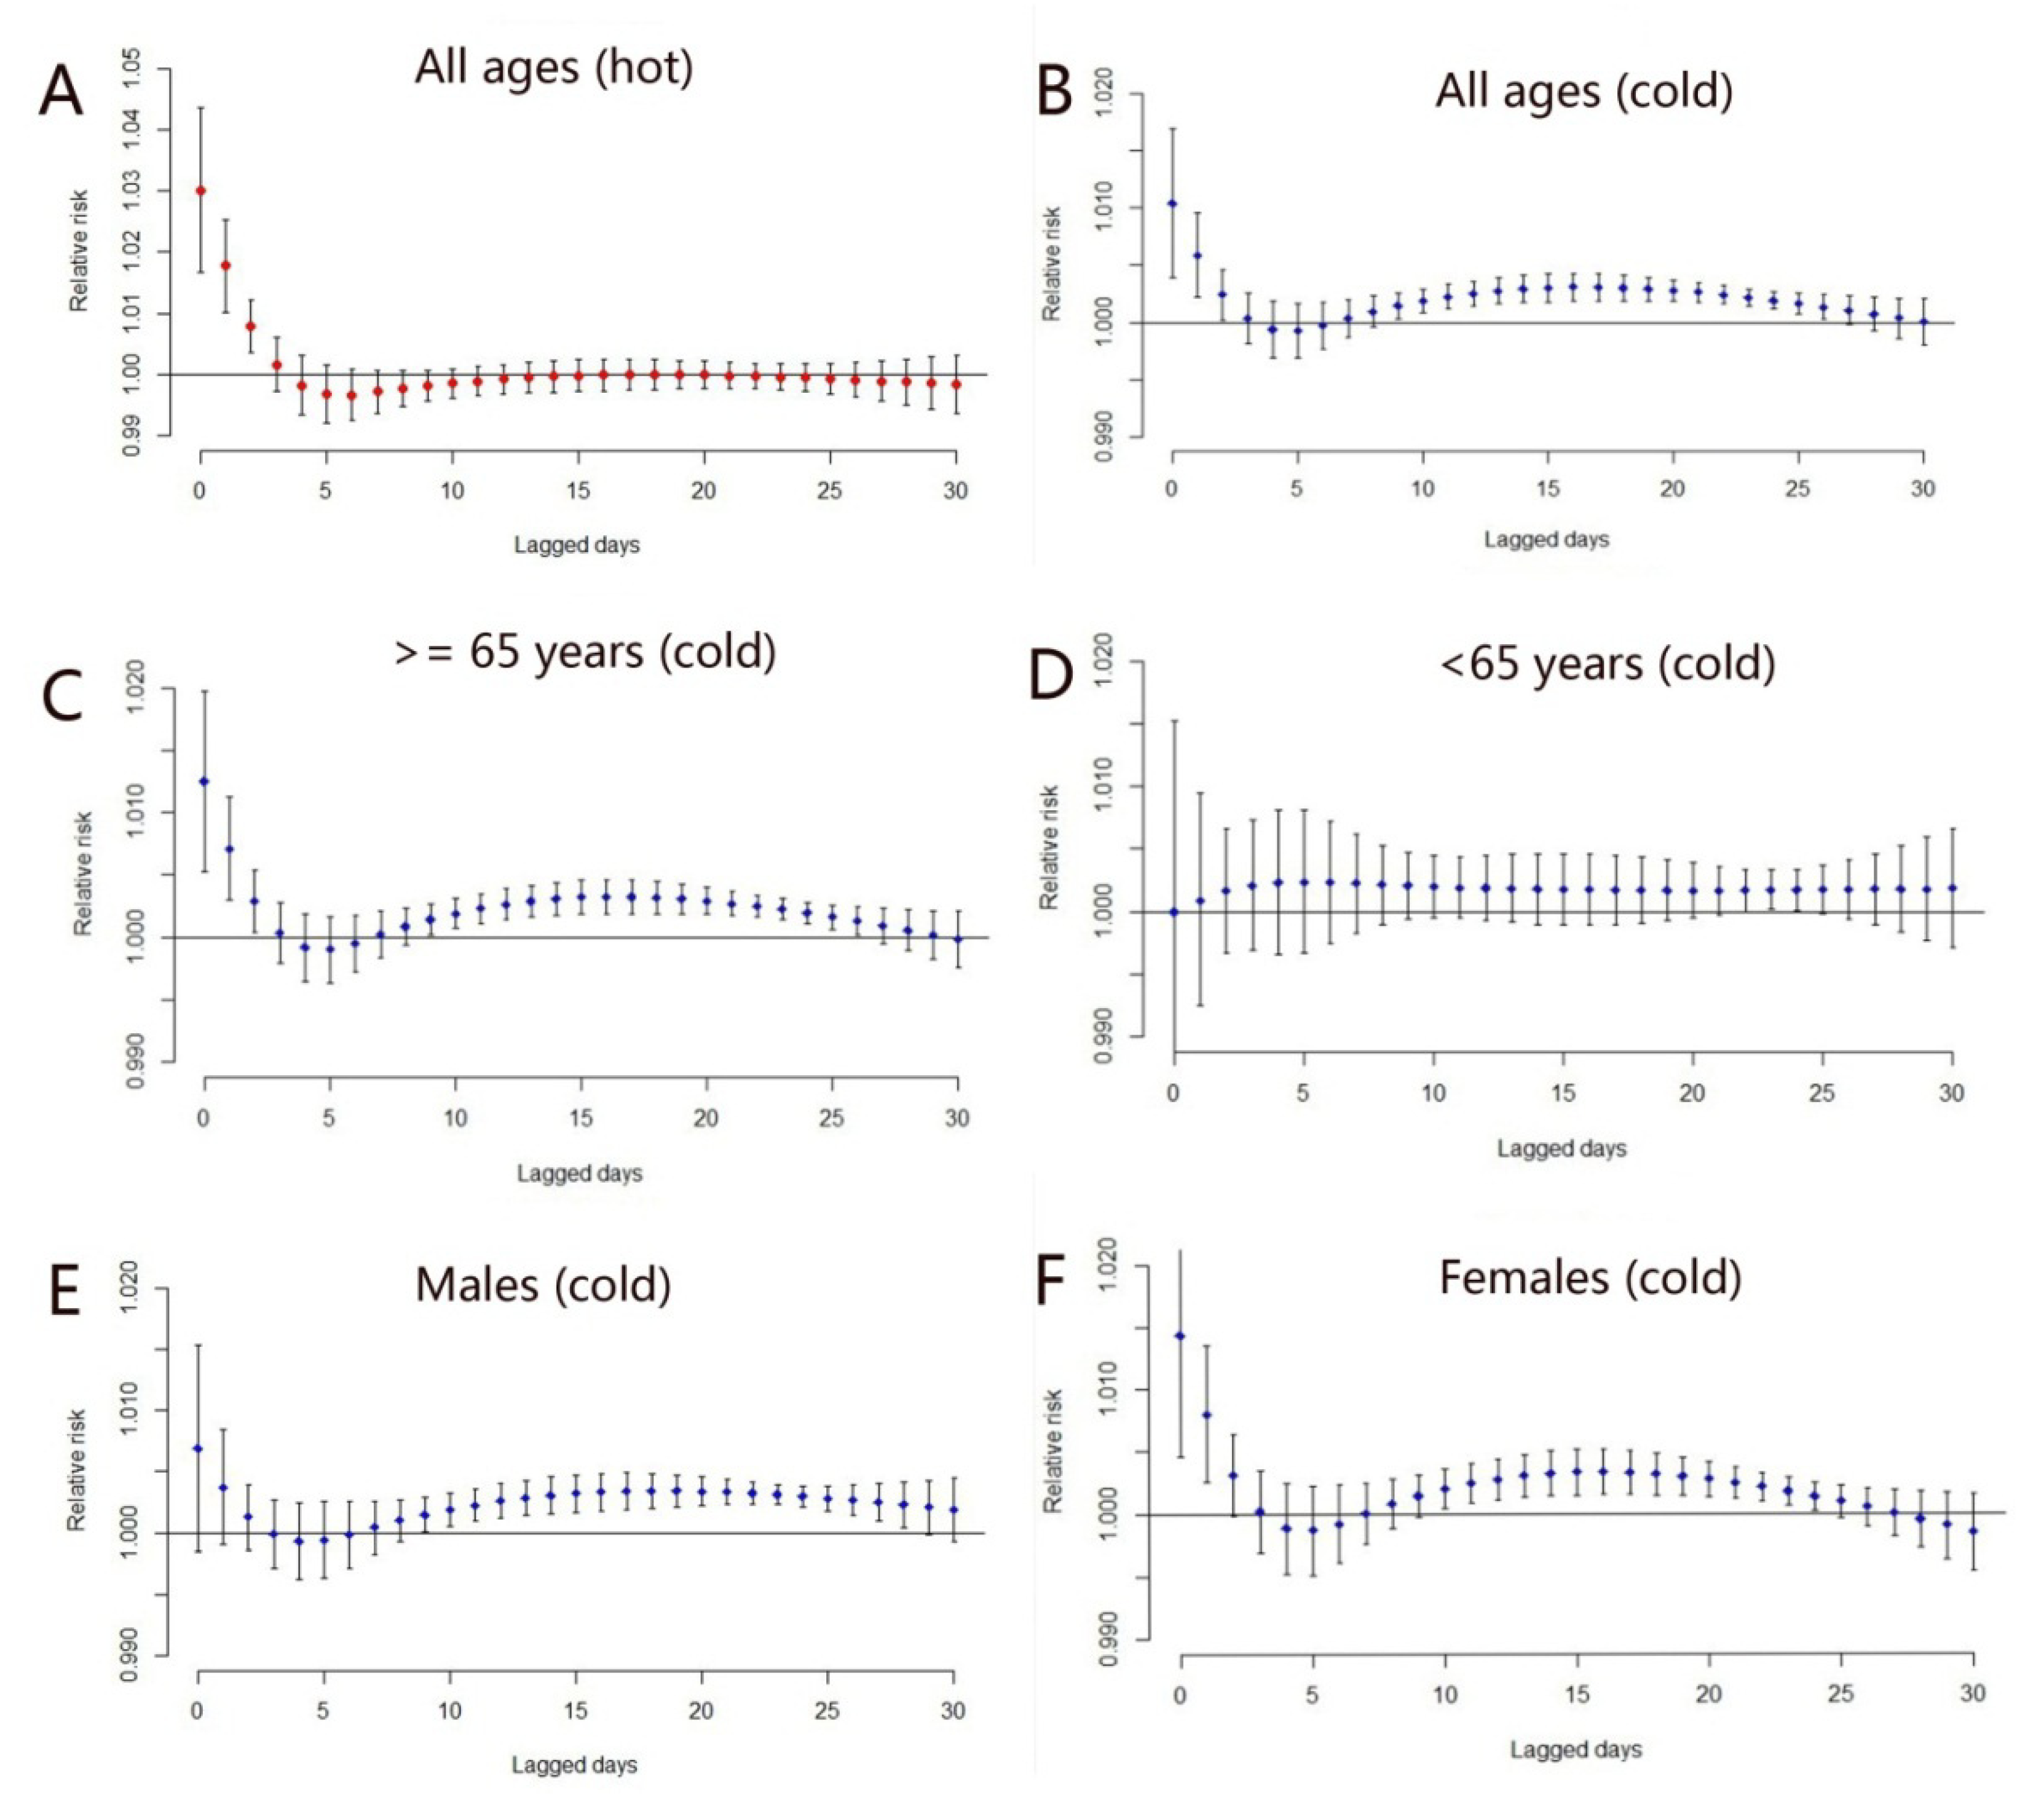
| Cold Effect (<10 °C) | Heat Effect (>29 °C) | |||
|---|---|---|---|---|
| Estimate (%) | 95%CI | Estimate (%) | 95% CI | |
| All ages | 6.6 * | 5.2–8.2 | 4.9 * | 2.0–7.9 |
| Older age (≥65) | 7.2 * | 5.3–9.1 | 4.4 * | 1.3–7.7 |
| Younger age (<65) | 5.4 * | 2.9–8.1 | 5.2 | −0.1–11.4 |
| Males | 6.4 * | 5.6–8.2 | 3.9 * | 0.1–7.9 |
| Females | 6.7 * | 4.6–8.8 | 6.0 * | 2.0–10.9 |

4. Discussions
5. Conclusions
Acknowledgements
Author Contributions
Conflicts of Interest
References
- Anderson, T.W.; Le Riche, W.H. Cold weather and myocardial infarction. Lancet. 1970, 1, 291–296. [Google Scholar] [CrossRef]
- Marchant, B.; Ranjadayalan, K.; Stevenson, R.; Wilkinson, P.; Timmis, A.D. Circadian and seasonal factors in the pathogenesis of acute myocardial infarction: The influence of environmental temperature. Br. Heart J. 1993, 69, 385–387. [Google Scholar] [CrossRef]
- Spencer, F.A.; Goldberg, R.J.; Becker, R.C.; Gore, J.M. Seasonal distribution of acute myocardial infarction in the second national registry of myocardial infarction. J. Am. Coll. Cardiol. 1998, 31, 1226–1233. [Google Scholar]
- Lawlor, D.A.; Smith, G.D.; Mitchell, R.; Ebrahim, S. Temperature at birth, coronary heart disease, and insulin resistance: Cross sectional analysis of the British women’s heart and health study. Heart 2004, 90, 381–388. [Google Scholar] [CrossRef]
- Pan, W.H.; Li, L.A.; Tsai, M.J. Temperature extremes and mortality from coronary heart disease and cerebral infarction in elderly Chinese. Lancet 1995, 345, 353–355. [Google Scholar] [CrossRef]
- Filleul, L.; Cassadou, S.; Medina, S.; Fabres, P.; Lefranc, A.; Elistein, D.; Le Tertre, A.; Pascal, L.; Chardon, B.; Blanchard, M.; et al. The relation between temperature, ozone, and mortality in nine French cities during the heat waves of 2003. Environ. Health Persp. 2006, 114, 1344–1347. [Google Scholar] [CrossRef]
- Zhai, P.; Sun, A.; Ren, F.; Liu, X.; Gao, B.; Zhang, Q. Changes of climate extremes in China. Climate Change 1999, 42, 203–218. [Google Scholar] [CrossRef]
- Curriero, E.C.; Heiner, K.S.; Samet, J.M.; Zeger, S.L.; Strug, L.; Patz, J.A. Temperature and mortality in 11 cities of the eastern United States. Am. J. Epidemiol. 2002, 155, 80–87. [Google Scholar] [CrossRef]
- Kassomenos, P.; Gryparis, A.; Samoli, E.; Katsouyanni, K.; Lykoudis, S.; Flocas, H.A. Atmospheric circulation types and daily mortality in Athens, Greece. Environ. Health Perspect. 2001, 109, 591–596. [Google Scholar]
- Eurowinter Group. Cold exposure and winter mortality from ischaemic heart disease, cerebrovascular disease, respiratory disease and all causes in warm and cold regions of Europe. Lancet 1997, 349, 1341–1346. [Google Scholar] [CrossRef]
- Chung, J.Y.; Honda, Y.; Hong, Y.C.; Pan, X.C.; Guo, Y.L.; Kim, H. Ambient temperature and mortality: An international study in four capital cities of East Asia. Sci. Total Environ. 2009, 408, 390–396. [Google Scholar] [CrossRef]
- Rogot, E.; Blackwelder, W.C. Associations of cardiovascular mortality with weather in Memphis, Tennessee. Public Health Rep. 1970, 85, 25–39. [Google Scholar]
- Anderson, B.G.; Bell, M.L. Weather-related mortality: How heat, cold, and heat waves affect mortality in the United States. Epidemiology. 2009, 20, 205–213. [Google Scholar] [CrossRef]
- Medina-Ramon, M.; Schwartz, J. Temperature, temperature extremes, and mortality: A study of acclimatization and effect modification in 50 US cities. Occup. Environ. Med. 2007, 64, 827–833. [Google Scholar] [CrossRef]
- Braga, A.L.; Zanobetti, A.; Schwartz, J. The effect of weather on respiratory and cardiovascular deaths in 12 US cities. Environ. Health Perspect. 2002, 111, 1712–1718. [Google Scholar]
- Karkstein, L.S.; Davis, R.E. Weather and human mortality: An evaluation of demographic and interregional responses in the United States. Ann. Assoc. Am. Geogr. 1989, 79, 44–64. [Google Scholar] [CrossRef]
- Yu, W.W.; Hu, W.B.; Mengersen, K. Time course of temperature effects on cardiovascular mortality in Brisbane, Australia. Heart. 2011, 97, 1089–1093. [Google Scholar] [CrossRef] [Green Version]
- Healy, J.D. Excess winter mortality in Europe: A cross county analysis identifying key risk factors. J. Epidemiol. Community Health. 2003, 57, 784–789. [Google Scholar] [CrossRef]
- Tian, Z.X.; Li, S.S.; Zhang, J.L.; Jaakkola, J.; Guo, Y.M. Ambient temperature and coronary heart disease mortality in Beijing, China: A time series study. Environ. Health. 2012, 11. [Google Scholar] [CrossRef]
- Schwartz, J. Who is sensitive to extremes of temperature? A case-only analysis. Epidemiology. 2005, 16, 67–72. [Google Scholar] [CrossRef]
- Douglas, A.S.; Dunnigan, M.G.; Allan, T.M.; Rawles, J.M. Seasonal variation in coronary heart disease in Scotland. J. Epidemiol. Community Health 1995, 49, 575–582. [Google Scholar] [CrossRef]
- Guo, Y.M.; Barnett, A.G.; Pan, X.C.; Yu, W.W.; Tong, S.L. The impact of temperature on mortality in Tianjin, China: A case-crossover design with a disdributed lag nonlinear model. Environ. Health Perspect. 2011, 119, 1719–1725. [Google Scholar] [CrossRef] [Green Version]
- Changsha Statistics Yearbook 2012. Available online: http://www.cstj.gov.cn/tjnj/2012/mulu.html (accessed on 23 January 2014).
- Hu, M.; Jia, L.; Wang, J.; Pan, Y. Spatial and temporal characteristics of particulate matter in Beijing, China using the Empirical Mode Decomposition method. Sci. Total Environ. 2013, 458–460, 70–80. [Google Scholar]
- Wu, W.; Xiao, Y.; Li, G.; Zeng, W.; Lin, H.; Rutherford, S.; Xu, Y.; Luo, Y.; Xu, X.; Chu, C.; et al. Temperature-mortality relationship in four subtropical Chinsese cities: A time-series study using a distributed lag non-linear model. Sci. Total Environ. 2013, 449, 355–362. [Google Scholar] [CrossRef]
- Hastie, T.J.; Tibshirani, R.J. Generalized Additive Models; Chapman and Hall: Dordrecht, the Netherlands, 1990. [Google Scholar]
- Dominici, F.; McDermott, A.; Zeger, S.L.; Samet, J.M. On the use of generalized additive models in time-series studies of air pollution and health. Am. J. Epidemiol. 2002, 156, 193–203. [Google Scholar] [CrossRef]
- Schwartz, J. The distributed lag between air pollution and daily deaths. Epidemiology 2000, 11, 320–326. [Google Scholar] [CrossRef]
- Akaike, H. Information Theory and An Extension of the Maximum Likelihood Principle. In Second International Symposium on Information Theory; Petrov, B.N., Caski, F., Eds.; Akademiai Kiado: Budapest, Hungary, 1973; pp. 267–281. [Google Scholar]
- Wood, S.N. Generalized Additive Models: An Introduction with R; Chapman and Hall: Dordrecht, the Netherlands, 2006. [Google Scholar]
- Gasparrini, A.; Armstrong, B.; Kenward, M.G. Distributed lag non-linear models. Stat. Med. 2010, 29, 2224–2234. [Google Scholar] [CrossRef]
- Yu, W.; Vaneckova, P.; Mengersen, K.; Pan, X.; Tong, S. Is the association between temperature and mortality modified by age, gender and socio-economic status? Sci. Total Environ. 2010, 408, 3513–3518. [Google Scholar] [CrossRef]
- Dominici, F.; McDermott, A.; Hastie, T.J. Improved semiparametric time series models of air pollution and mortality. J. Am. Stat. Assoc. 2004, 99, 938–949. [Google Scholar] [CrossRef]
- Su, B.D.; Jiang, T.; Jin, W.B. Recent trends in observed temperature and precipitation extremes in the Yangtze River basin, China. Theor. Appl. Climatol. 2006, 83, 139–151. [Google Scholar] [CrossRef]
- Bayentin, L.; Adlouni, S.E.; Quarda, T.B.; Gosselin, P.; Doyon, B.; Chebana, F. Spatial variability of climate effects on ischemic heart disease hospitalization rates for the period 1989–2006 in Quebec, Canada. Int. J. Health Geogr. 2010, 9. [Google Scholar] [CrossRef]
- Keatinge, W.R.; Coleshaw, S.R.; Easton, J.C.; Cotter, F.; Mattock, M.B.; Chelliah, R. Increased platelet and red cell counts, blood viscosity, and plasma cholesterol levels during heat stress, and mortality from coronary and cerebral thrombosis. Am. J. Med. 1986, 81, 795–800. [Google Scholar] [CrossRef]
- Liu, L.; Breitner, S.; Pan, X.; Franck, U.; Leitte, A.M.; Wiedensohler, A.; von Klot, S.; Wichmann, H.E.; Peters, A.; Schneider, A. Associations between air temperature and cardiorespiratory mortality in the urban area of Beijing, China: A time-series analysis. Environ. Health 2011, 10. [Google Scholar] [CrossRef]
- Fu, X. Conditions for determining the energy consumption standard in the Changjiang River Basin. J. HV&AC 1999, 29, 14–17. (in Chinese). [Google Scholar]
- Hong, Y.C.; Rha, J.H.; Lee, J.T.; Ha, E.H.; Kim, H. Ischemic stroke associated with decrease in temperature. Epidemiology 2003, 14, 473–478. [Google Scholar]
- Stewart, S.; Mcintyre, K.; Capewell, S.; McMurray, J.J. Heart failure in a cold climate. Seasonal variation in heart failure-related morbidity and mortality. J. Am. Coll. Cardiol. 2002, 39, 760–766. [Google Scholar] [CrossRef]
- Barnett, A.G. Temperature and cardiovascular deaths in the US elderly: Changes over time. Epidemiology 2007, 18, 369–372. [Google Scholar] [CrossRef]
© 2014 by the authors; licensee MDPI, Basel, Switzerland. This article is an open access article distributed under the terms and conditions of the Creative Commons Attribution license (http://creativecommons.org/licenses/by/3.0/).
Share and Cite
Huang, J.; Wang, J.; Yu, W. The Lag Effects and Vulnerabilities of Temperature Effects on Cardiovascular Disease Mortality in a Subtropical Climate Zone in China. Int. J. Environ. Res. Public Health 2014, 11, 3982-3994. https://doi.org/10.3390/ijerph110403982
Huang J, Wang J, Yu W. The Lag Effects and Vulnerabilities of Temperature Effects on Cardiovascular Disease Mortality in a Subtropical Climate Zone in China. International Journal of Environmental Research and Public Health. 2014; 11(4):3982-3994. https://doi.org/10.3390/ijerph110403982
Chicago/Turabian StyleHuang, Jixia, Jinfeng Wang, and Weiwei Yu. 2014. "The Lag Effects and Vulnerabilities of Temperature Effects on Cardiovascular Disease Mortality in a Subtropical Climate Zone in China" International Journal of Environmental Research and Public Health 11, no. 4: 3982-3994. https://doi.org/10.3390/ijerph110403982