Article Text

Abstract
Objective To examine cardiovascular disease (CVD) mortality burden attributable to ambient temperature; to estimate effect modification of this burden by gender, age and education level.
Methods We obtained daily data on temperature and CVD mortality from 15 Chinese megacities during 2007–2013, including 1 936 116 CVD deaths. A quasi-Poisson regression combined with a distributed lag non-linear model was used to estimate the temperature-mortality association for each city. Then, a multivariate meta-analysis was used to derive the overall effect estimates of temperature at the national level. Attributable fraction of deaths were calculated for cold and heat (ie, temperature below and above minimum-mortality temperatures, MMTs), respectively. The MMT was defined as the specific temperature associated to the lowest mortality risk.
Results The MMT varied from the 70th percentile to the 99th percentile of temperature in 15 cities, centring at 78 at the national level. In total, 17.1% (95% empirical CI 14.4% to 19.1%) of CVD mortality (330 352 deaths) was attributable to ambient temperature, with substantial differences among cities, from 10.1% in Shanghai to 23.7% in Guangzhou. Most of the attributable deaths were due to cold, with a fraction of 15.8% (13.1% to 17.9%) corresponding to 305 902 deaths, compared with 1.3% (1.0% to 1.6%) and 24 450 deaths for heat.
Conclusions This study emphasises how cold weather is responsible for most part of the temperature-related CVD death burden. Our results may have important implications for the development of policies to reduce CVD mortality from extreme temperatures.
Statistics from Altmetric.com
Introduction
In recent decades, reports have pointed out that extreme weather (eg, heatwaves and cold spells) due to climate change is one of most serious challenges worldwide, with direct (eg, excess morbidity and mortality) impact on human health.1 The definition and implementation of adaptation and mitigation strategies to extreme weather require a comprehensive and in-depth understanding and quantification of the effects of weather factors on human health.
Cardiovascular diseases (CVDs) are highly sensitive to weather variations.2 ,3 CVD includes coronary heart disease, strokes and other heart diseases, and represents the top cause of death globally. In the last decades, the prevalent rate have changed differently between developed and developing countries, with a decline in many high-income countries but a rapid increase in low-income and middle-income countries.4 Based on economic development, population ageing, and changes in diet and physical activity, annual CVD events are predicted to increase by an additional 23% with 7.7 million CVD deaths over 2010–2030 alone in China.5
Estimating the extent to which temperatures affect CVD mortality is very important for the development of the healthcare system to reduce temperature-induced CVD events, for example, clinics, hospitals and nursing centres should add more staff and increase their rotation during extreme cold and hot days. However, most previous studies examined the relation in terms of ratio measures, such as relative risk (RR) and OR, providing estimates of the exposure-response relationship.6–10 These indicators provided limited information on the excess burden due to exposure, comparing relative attributable measures, such as attributable fraction and attributable number, which are more suitable for estimating potential benefits of preventive interventions.
To date, only few studies have reported estimates of the temperature-related mortality using attributable risk, such as absolute excess (numbers) or relative excess (fraction) of deaths.11–13 These studies limited the analysis to one single city and applied relatively simple statistical models unable to capture the non-linear and delayed effects of temperatures. Moreover, less evidence was available on this topic from developing countries. In this contribution, we aimed to provide figures of attributable burden of CVD mortality due to temperatures, separating the contributions of cold and heat effects from a national-scale analysis in China, and to assess the effect modification of temperatures on CVD mortality by individual characteristics (eg, gender, age group and education level).
Methods
Data collection
We collected data on the daily number of deaths and meteorological data from 15 large cities in China (Harbin, Changchun, Beijing, Shenyang, Tianjin, Shijiazhuang, Jinan, Zhengzhou, Shanghai, Nanjing, Chengdu, Chongqing, Changsha, Kunming and Guangzhou) during 2007–2013 (figure 1). The latitudes varied from 23.2N of Guangzhou to 45.4N of Harbin. Our study was restricted to the urban areas because the Death Registry has not been well established in suburban and rural regions in China.

The locations of 15 Chinese cities in this study, with attributable cardiovascular mortality fraction computed as total and as separated components for cold and hot temperatures.
The daily counts of death data were obtained from the China Information System of Death Register and Report of Chinese Center for Disease Control and Prevention (China CDC) from 1 January 2007 to 31 December 2013. The causes of death were coded by China CDC according to the International Classification of Diseases, Tenth Revision (ICD-10): CVD (ICD-10: I00-I99). In addition, we stratified the data by different groups, including gender and age group (0–64 years, 65–74 years and 75+ years), and education level (illiterate, primary education, and high school and above).
The daily weather data were collected from the China Meteorological Data Sharing Service System (http://cdc.nmic.cn/home.do) from one weather monitoring station for each city during the study period. Weather data include daily mean temperature, maximum and minimum temperatures, relative humidity, and atmospheric pressure. We used mean daily temperature to estimate the effects of temperature on CVD mortality, as it represents the exposure throughout the entire day and night and provides more easily interpretable results in a policy context.
Statistical analysis
We conducted a two-stage analysis to estimate the CVD mortality risk attributable to cold and hot temperatures. At the first stage, individual-city data were analysed and city-specific effect estimates were extracted and subsequently used in a second-stage meta-analysis to produce pooled estimates.
At the first stage, we adopted the distributed lag non-linear model (DLNM) combined with a quasi-Poisson regression to examine city-specific non-linear and lag effects of temperature on CVD mortality. The city-specific Poisson regression model is given as follows: where Yt is the observed daily deaths at calendar day t (t=1, 2, 3 … 2557); α is the intercept; Tempt,l was the cross-basis matrix produced by DLNM.14 This matrix is obtained by the combination of the exposure-response function with a natural cubic spline with three internal knots placed at the 10th, 75th and 90th percentiles of city-specific temperature distributions, and the lag-response function modelled with a natural cubic spline with three internal knots placed at equally spaced values in the log scale. The maximum lag was set up to 21 days, for effects of cold temperature appeared only after some delay and lasted for several days, whereas effects of hot temperature were immediate and possibly affected by mortality displacement.15 ,16 NS(.) means a natural cubic spline; 8 df per year for time was used to control for the long term and seasonality;17 3 df was used for relative humidity (Hum) and atmospheric pressure (Press);9 Day of the week (Dow) and public holidays (Holiday) were also included in the model as indicator variables.9 ,16
At the second stage, a multivariate meta-analysis was applied to obtain the nationally pooled effect estimates, and then to produce the best linear unbiased prediction (BLUP) for city-specific relationships, using a method recently developed.15 Compared with the previous meta-analysis method, this methodology offers greater flexibility to capture the complex non-linear and delayed associations between exposure and outcome from multiple locations. To pool the associations between temperature and CVD mortality, we reduced the 16 estimated parameters of the cross-basis, representing the bidimensional exposure-lag-response surface, to the four parameters of the one-dimensional overall cumulative exposure-response curve. Heterogeneity was assessed through a multivariate extension of the I2 statistics,18 which quantifies the percentage of variability due to the true differences across cities.
The minimum-mortality temperature (MMT) is derived by the lowest point of the overall cumulative exposure-response curve, and it is interpreted as the optimal temperature characterised by the lowest risk of CVD mortality. The MMT, corresponding to a minimum mortality percentile (MMP) of temperature between the 1st and 99th, was selected from the city-specific cumulative overall temperature-mortality association, which were recentred on these values. The total attributable number of deaths due to non-optimal temperatures is calculated by summing the contributions from all the days of the series, using the MMT/MMP as the reference. The ratio with the total number of deaths produces the total attributable fraction. The components attributable to cold and hot temperatures were computed by summing the subsets corresponding to days with temperature below or above the MMT, respectively. Empirical CIs were obtained by Monte Carlo simulations assuming a multivariate normal distribution of the BLUPs of the reduced coefficients.19
Significance tests on the effect modification of gender, age and education level were performed in the second-stage metaregression. The coefficients of all stratum-level analyses were included in the same multivariate metaregression estimated by maximum likelihood, and the models with and without indicators for each characteristic were compared through a likelihood ratio test to determine whether the coefficients describing the temperature-mortality association change between the groups.
Sensitivity analyses were performed to test the robustness of our results by changing the location of knots for exposure-response and using 14–28 lag days, 6–10 df for time trend and 3–6 df for relative humidity and atmospheric pressure in the analyses, respectively.
All data analyses were performed using the R software (V.3.0.3, R Development Core Team 2010). The ‘dlnm’ package was used to fit the distributed lag non-linear model and the ‘mvmeta’ package to conduct the multivariate meta-analysis. For all statistical tests, two-tailed p<0.05 was considered statistically significant.
Results
Table 1 shows the descriptive data on population size, daily CVD mortality and mean temperature in the 15 Chinese cities included in the analysis. This study included more than 183.72 million permanent residents with daily mean CVD mortality counts ranging from 30 to 100 in various cities. The annual mean temperature ranged from 5.3°C in Harbin to 21.6°C in Guangzhou. Temperature ranges between cities were more varied during the cold season (see online supplementary table S1).
Descriptive data on cardiovascular disease (CVD) mortality and daily mean temperature (°C) in 15 Chinese cities during 2007–2013
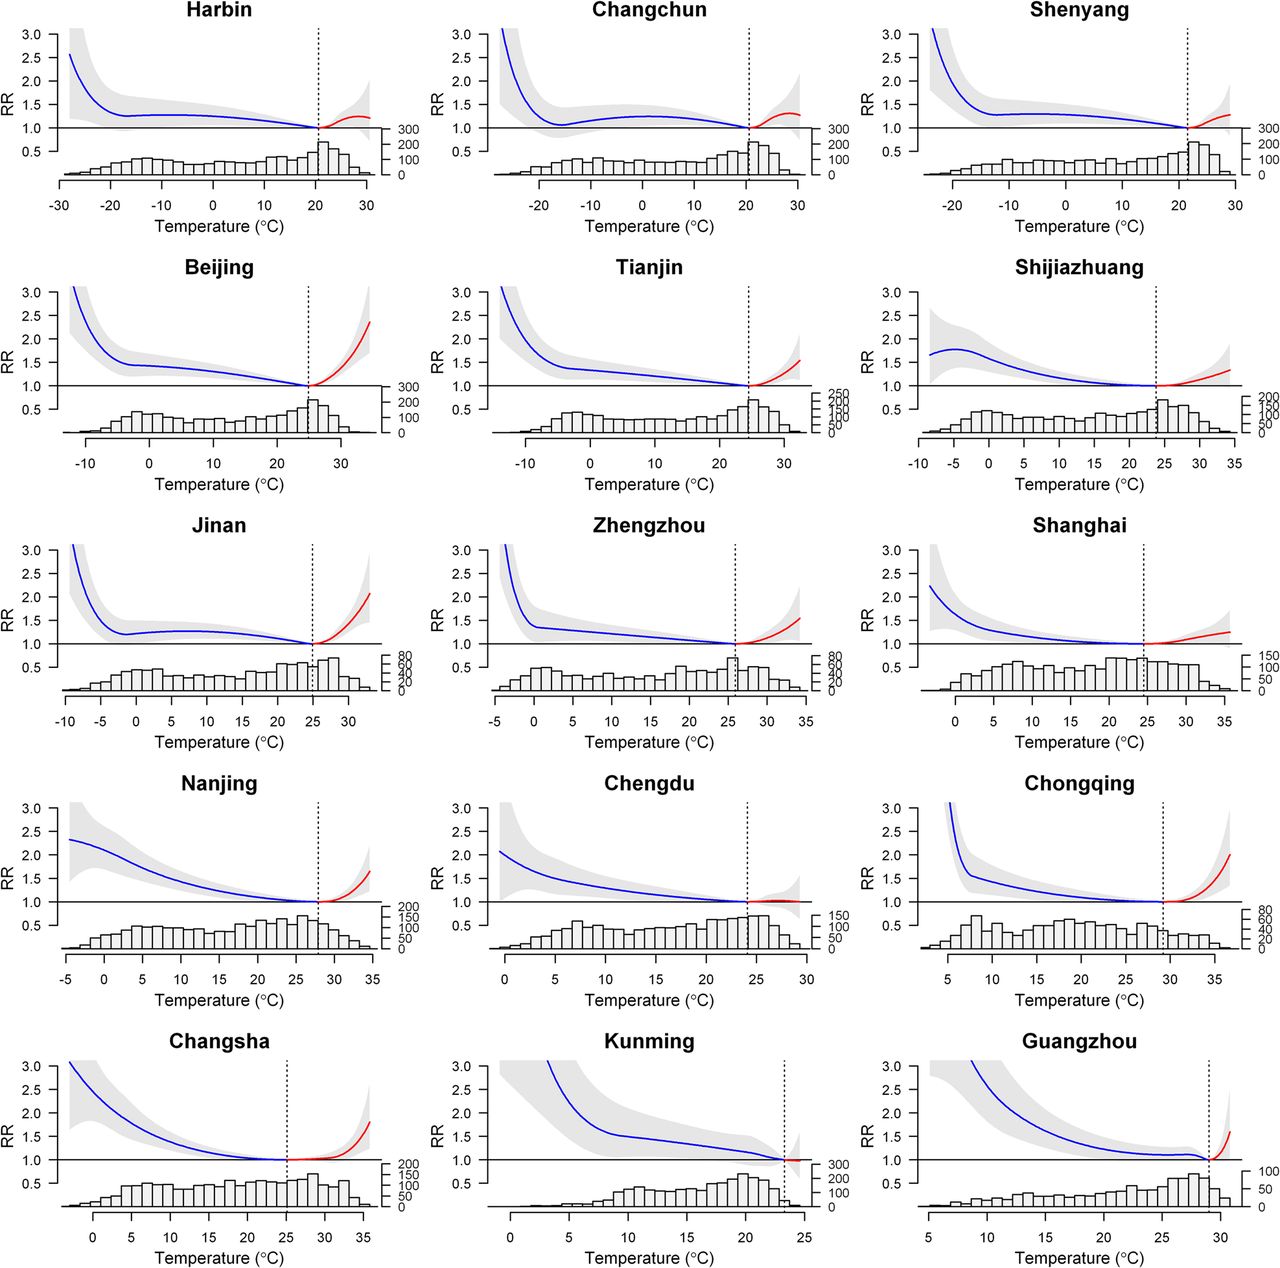
Figure 2 shows the overall cumulative exposure-response curves (BLUP) in those cities, with the corresponding MMT and temperature distribution. Generally, the temperature-mortality relationships were U-shaped at lag 0–21 days. The histogram plots show that most daily mean temperatures are below the MMT.
Table 2 reveals that the median MMP was 78th, ranging between the 70th and 99th percentiles of temperature. The I2 statistics indicate a large and significant between-city heterogeneity (86.6%, p<0.001). In total, 17.1% (95% empirical CI 14.4% to 19.1%) of CVD mortality, corresponding to 330 352 deaths, was attributed to temperature, although it varies substantially across cities, with the highest estimate in Guangzhou (23.7%) and the lowest estimate in Shanghai (10.1%). Cold temperature accounted for most of the burden, with a fraction of 15.8% (13.1% to 17.9%), corresponding to 305 902 deaths, while the burden due to hot temperature was comparatively smaller, with a fraction of 1.3% (1.0% to 1.5%), corresponding to 24 450 deaths (figure 1 and online supplementary table S2).
Attributable cardiovascular mortality fraction by cities computed as total and as separated components for cold and hot temperatures in 15 Chinese cities
Overall cumulative relative risk (RR) across lag 0–21 days (with 95% empirical CI, shaded grey) in 15 Chinese cities, with histogram of daily temperature distribution. The dashed grey lines are minimum-mortality temperatures. The lines before and after the dashed lines represent the exposure response below (lines on the left) and above (lines on the right) the minimum mortality temperatures.
The burden and heat/cold pattern was similar among men and women, while hot and cold attributable risks were higher among the elderly and those with low education level, but the differences within these subgroups were not statistically significant (p>0.05). The attributable fractions due to temperature were 16.4% (13.6% to 18.8%), 16.9% (14.1% to 19.1%) and 17.3% (14.6% to 19.4%) for people with age less than 65 years, 65–74 years and older than 75 years, respectively; figures of 18.1% (15.1% to 20.2%), 17.1% (14.1% to 19.1%) and 16.5% (13.9% to 18.7%) were estimated for the illiterate, people with primary school and those with higher education level, respectively (table 3).
The pooled attributable cardiovascular mortality fraction computed as total and as separated components for cold and hot temperatures, stratified by individual characteristics
The daily attributable fraction due to temperature generally had a significant seasonal trend, which was much higher in the cold months (November to February) than the hot months (May to September). There was also a small peak in June or July (see online supplementary figure S1).
Analyses were performed to test the sensitivity of our results to modelling choices. The effect estimates were similar when we changed the location of knots for the exposure-response relationship and 4–6 df for relative humidity and air pressure in the analyses; slightly smaller estimates were produced when using shorter maximum lag days or changing df for the time trends (eg, 6 or 10), respectively (see online supplementary table S3).
Discussion
To the best of our knowledge, this is the first study to examine CVD mortality attributable to ambient temperature in developing countries and the first study to explore effect modification of such risk by individual characteristics. The MMTs were generally distributed around the 78th percentile of temperature. The cold temperature was responsible for most of the temperature-related CVD mortality. The attributable burdens of hot and cold temperatures were higher among the elderly and those with lower education level.
The association between ambient temperature and CVD mortality has been well documented in numerous epidemiological studies.3 ,6 ,7 ,9 ,10 However, most of these studies measured the association using some ratio indicators, such as RR and OR. There were very few studies examining the attributable burden, either as absolute excess (attributable numbers) or relative excess (attributable fractions) of CVD deaths.11–13 Recently, an international study using a similar design by Gasparrini et al estimated a 11.3% of all-cause deaths were attributable to ambient temperatures in China,17 which was much smaller than our estimate of 17.1% of CVD deaths. Carson et al12 also reported a much smaller attributable fraction (4.6%) of CVD deaths due to cold but none due to hot temperature in London. These evidences confirmed that temperature-mortality association varied by regions, populations and climates.
The mechanistic effects of ambient temperature on cardiovascular pathophysiology are profound, which may be involved in the changes in vascular tone, autonomic nervous system response, arrhythmia and oxidative stress. The vascular tone change was observed from repeated measurements on two consecutive days during colder months (October–April) among 868 elderly individuals in Japan, a 1°C lower indoor temperature was significantly associated with 0.22 mm Hg higher daytime systolic blood pressure and 0.34 mm Hg higher sleep-trough morning blood pressure surge.20 Another study of rats exposed in a cold room at 4°C demonstrated attenuated sympathetic nerve stimulation-induced overflow of norepinephrine in the perfused mesenteric arterial bed.21 Cold exposure was also found to increase the frequency of heart rate variability and ventricular ectopic beats.22 In addition, exposure to cold caused significant increase of inflammatory cytokines and methane dicarboxylic aldehyde and decline of superoxide dismutase (SOD) and glutathione peroxidase activity,23 and the genes involved in the hypoxia-inducible factor signalling pathway were activated in which oxidative stress-associated genes were significantly upregulated, including SOD2 and epoxide hydrolase 2.24 On the other hand, exposure to hot weather may induce profound physiological changes, such as increase in blood viscosity and cardiac output leading to dehydration, hypotension, surface blood circulation increase and even endothelial cell damage.25 These responses may overload the heart function and cause haemoconcentration, and induce a failure of thermoregulation. Further mechanistic studies are warranted to disentangle these complex relationships between CVD and ambient temperature.
Our results showed that cold effects accounted for over 90% of temperature-related CVD mortality. These findings indicate that cold temperature plays an important role in the winter excess mortality of CVD. The policy maker, the local community and the public should strengthen the awareness of preventing harmful health effect of cold temperature, especially for people in the southern areas, where central heating was not available in winter. Moreover, the attributable fraction of CVD mortality due to temperature varies by cities, ranging from 10.1% to 23.7%. Generally, the heat-related mortality fraction was higher in the north than in the south while there was higher cold-related fraction in the south; the heat/cold-related mortality fraction was moderately correlated with annual mean temperature (Spearman's correlation coefficient rs=−0.626 for heat effect (p=0.013); rs=0.502 for cold effect (p=0.051)). Consistently, the MMT increased from the north to the south, which was strongly correlated with annual mean temperature (Spearman's correlation coefficient rs=0.772; p=0.001). This phenomenon indicates that people could acclimatise to their local environmental conditions through physiological adaptation and individual behaviours. Populations in the northern regions are more vulnerable to heat, while people in the southern regions are more sensitive to cold weather. The popularity of air-conditioning and household heating appliances can be helpful to mitigate the health effects of hot and cold temperatures, respectively.
Many epidemiological studies have provided evidence that susceptibility to cold and hot temperatures is modified by age, gender and education level. For hot and cold temperatures, the effects were clearly larger in the elderly than in the youth. Aging induces physiological changes in thermoregulation and homoeostasis, together with the prevalence of pre-existing chronic conditions, limiting capacity to prevent cardiovascular (CV) events, and use of medication, offering susceptibility to hot and cold stress.26 The increasing disease burden of CVD in China has been a significant challenge to the government and the societal infrastructure that affects the economic growth and the healthcare system. Age-appropriate primary care exacerbated by user fees and social protection, and community-based measures should be targeted particularly for the elderly, especially at the time of hot and cold weathers.
Effect modification by gender varied among different regions and population. For example, the impact of hot temperature was higher for women in Mexico, but higher for men in Sao Paulo.27 The differences in occupational exposure, physiology and thermoregulation may contribute to the temperature-related susceptibility between genders.9 ,28 ,29 Education level is viewed as one of the most important indicators relating to one's overall socioeconomic status. Previous investigations have reported that those with low socioeconomic status have a greater vulnerability to temperature-related mortality,9 ,27 which may be associated with poorer health status, limited access to healthcare, poor housing conditions, lack of knowledge and unhealthy behaviour patterns such as smoking. These disadvantageous factors may reduce their capacity to take proper precautions in the heat or cold to prevent CV events.
This study has some limitations. First, this study applies specifically to urban populations and isn't necessarily able to be generalised to the rural areas in China where cold and heat effects may be greater because of even less consistent access to central heating or air-conditioning. Similar to previous time-series investigations, this study only assessed short-term effects of temperature on CVD mortality after controlling for long-term trend and other covariates, while a large element of CVD may be due to long-term pathology. Third, the attributable fraction was calculated assuming the causality between cold/hot temperatures and mortality, although the evidence is still limited on this association. However, extensive epidemiological studies have shown that the cold and hot temperatures have impacts on human mortality2 ,3 ,8–11 and morbidity.24 ,30 Fourth, the use of data on temperatures were from fixed monitoring sites rather than measuring individual exposure, which may create to some extent measurement errors in the exposure. However, these errors are likely to be random. Meanwhile, we cannot ignore the misclassification bias since CV cause of death was assigned according to the ICD 10 code on the death certificate. Fifth, data on air pollutants were not controlled for in this study, because these data were not available. However, previous studies have found that the effect of temperature on mortality did not change when controlling for air pollution.9 ,16
Conclusions
Cold temperature was responsible for most of the temperature-related CVD mortality in China. Our results may contribute significantly to the understanding of the adverse health effects of cold and hot temperatures on CVD mortality. It may also have important public health implications for policy makers and local communities with the aim of protecting vulnerable subpopulations from ambient extreme temperatures.
Key messages
What is already known on this subject?
Cardiovascular disease (CVD) is the leading cause of mortality and is particularly sensitive to climate change. Extreme ambient temperatures are associated with an increased relative risk of CVD mortality.
What might this study add?
Temperature was responsible for advancing 17.1% of CVD mortality. The majority of CVD mortality burden of ambient temperature was caused by cold. The daily attributable fraction due to temperature had a significant peak in the cold months (November to February). CVD mortality burden of cold and hot temperatures were higher among the elderly and those with lower education level.
How might this impact on clinical practice?
Cold temperature plays an important role in winter excess mortality of CVD. Public health policies and adaptive measures should be extended to reduce the temperature-related, particularly cold-related, CVD mortality especially in the developing countries. More attention should be paid to the vulnerable subpopulations.
References
Supplementary materials
Supplementary Data
This web only file has been produced by the BMJ Publishing Group from an electronic file supplied by the author(s) and has not been edited for content.
- Data supplement 1 - Online supplement
Footnotes
JY and PY are co-first authors.
Contributors JY and QL initiated the study. MZ, PY and QL collected the data. JY, YL and GL cleaned the data. JY performed statistical analysis. AG developed the statistical methods and software implementation. JY and C-QO drafted the manuscript. YG, AG, YY, SG, SS, QS and QL revised the manuscript. All authors read and approved the final manuscript.
Funding National Basic Research Program of China (973 Program) (Grant No. 2012CB955504). Dr Gasparrini was supported by the Medical Research Council-UK [Grant IDs: MR/M022625/1 and G1002296]; Prof. Ou was supported by the National Natural Science Foundation of China (81573249); Dr Yuming was supported by The University of Queensland Postdoctoral Research Fellowship.
Competing interests None declared.
Ethics approval Ethics Committee of the Chinese Center for Disease Control and Prevention (No.201214).
Provenance and peer review Not commissioned; externally peer reviewed.