Article Text

Abstract
Objectives The traditional risk score (RAMA-EGAT) has been shown to be an accurate scoring system for predicting coronary artery disease (CAD). Arterial stiffness measured by the cardio–ankle vascular index (CAVI) is known to be a marker of atherosclerotic burden. A study was undertaken to determine whether CAVI improves the prediction of CAD beyond the RAMA-EGAT score.
Design Cross-sectional study.
Patients Patients with a moderate to high risk for CAD by the RAMA-EGAT score were enrolled between November 2005 and March 2006. 64-slice multidetector CT coronary angiography was used to evaluate the coronary artery calcium score and coronary stenosis. Arterial stiffness was assessed by CAVI.
Results 1391 patients of median age 59 years (range 31–88) were enrolled in the study, 635 (45.7%) men and 756 (54.3%) women. Of the 1391 patients, 346 (24.87%) had coronary stenosis. There was a correlation between CAVI and the prevalence of coronary stenosis after adjusting for traditional CAD risk factors (OR 3.29). In addition, adding CAVI into the RAMA-EGAT score (modified RAMA-EGAT score) improved the prediction of CAD incidence, increasing C-statistics from 0.72 to 0.85 and resulting in a net reclassification improvement of 27.7% (p<0.0001).
Conclusion CAVI is an independent risk predictor for CAD. The addition of CAVI to the RAMA-EGAT score significantly improves the diagnostic yield of CAD.
- Coronary artery disease
- imaging and diagnostics
- risk factors
This is an open-access article distributed under the terms of the Creative Commons Attribution Non-commercial License, which permits use, distribution, and reproduction in any medium, provided the original work is properly cited, the use is non commercial and is otherwise in compliance with the license. See: http://creativecommons.org/licenses/by-nc/2.0/ and http://creativecommons.org/licenses/by-nc/2.0/legalcode.
Statistics from Altmetric.com
Introduction
Several risk scores have been developed to predict the occurrence of cardiovascular disease (CVD).1–3 The Framingham risk equation is probably the best known, but it tends to over-predict the cardiovascular risk in the Asian population.4 In Thailand the RAMA-EGAT score was developed from the retrospective study of the Electricity Generating Authority of Thailand (EGAT) using traditional risk factors including age, gender, cholesterol level, smoking status, diabetes, hypertension and waist circumference.5 This score has been validated in the Thai population and was shown to be a more suitable score for evaluating cardiovascular risk in Thai subjects than the Framingham risk score.6 Also, the score shows a linear relationship with the percentage of coronary stenosis as evaluated by 64-slice multidetector CT (MDCT) coronary angiography.7 Although the classic risk factors remained the key components in the risk factors analysis model, a recent CT angiography study showed that traditional clinical risk assessment tools do not accurately predict the coronary atherosclerotic plaque burden.8 Additional risk factors to improve the accuracy of prediction of coronary artherosclerotic plaque are therefore needed.
Arterial stiffness is a non-traditional risk factor which has an independent predictive value for all-cause mortality, cardiovascular mortality, CVD, fatal and non-fatal coronary events in patients with various cardiovascular risks: very high (end-stage renal disease),9 10 high (diabetes),11 moderate (uncomplicated essential hypertension),12–14 low (general population)15 and healthy elderly subjects.16–18 Arterial stiffness can be measured non-invasively by various methodologies19 including aortic pulse wave velocity (PWV),20 brachio–ankle PWV21 and the recently developed cardio–ankle vascular index (CAVI).22
CAVI, which represents the stiffness of the aorta, femoral artery and tibial artery, is measured by an ECG, phonocardiogram (PCG) and PWV from the starting point of the aorta from the heart to the ankle as well as blood pressure. This index is calculated from the heart–ankle pulse wave velocity (haPWV) adjusted for blood pressure based on a stiffness parameter.23 Since both aortic PWV and brachio–ankle PWV to predict arterial stiffness are blood pressure-dependent, CAVI may be better for predicting arterial stiffness.24 CAVI has been reported to have good reproducibility in patients having routine check-ups, in those with type 2 diabetes and haemodialysis patients with atherosclerotic disease.25 In addition, in patients with a high risk of CVD, the accuracy and usefulness of CAVI have been reported to be comparable with other parameters of atherosclerosis, suggesting that CAVI may be useful as a long-term predictor of CVD risk.26 27 However, no large-scale study has been performed to validate this association.28
Contrast-enhanced CT angiography is a technique that can display all coronary plaque, non-calcified as well as calcified.29 A number of studies have assessed the diagnostic accuracy of 64-slice MDCT coronary angiography for detecting coronary artery stenosis.30–35 The purpose of this study was to investigate the association of CAVI and coronary artherosclerosis as assessed by 64-slice MDCT coronary angiography in patients with a moderate risk of coronary artery disease (CAD) in the Thai population. We also tried to determine whether the addition of CAVI to our traditional risk score (RAMA-EGAT score) improves the diagnostic yield of the coronary atherosclerotic plaque burden.
Methods
Study population
The study population comprised patients referred for evaluation with 64-slice MDCT coronary angiography due to suspected CAD at Ramathibodi Hospital between November 2005 and March 2006. Patients with peripheral arterial disease (ankle–brachial index <0.9), those who declined or had any contraindications to contrast media (previous allergic reaction to contrast media, severe renal insufficiency), those with atrial fibrillation and those who were unable to hold their breath long enough for the CT scan time were excluded from the study. The ethics committee of Ramathibodi Hospital provided approval for the study and informed consent was obtained from all patients prior to participation. All participants were interviewed for the traditional risk factors listed in the RAMA-EGAT score (table 1).
Traditional risk factors (RAMA-EGAT score)
Measurement of CAVI
CAVI was measured with a VaSera CAVI instrument (Fukuda Denshi Co Ltd, Tokyo, Japan) using the methods described in the literature.22 25 Briefly, patients were placed in the supine position for at least 10 min with monitoring of the ECG and PCG. The CAVI was derived from the PWV and blood pressure using the following equation:
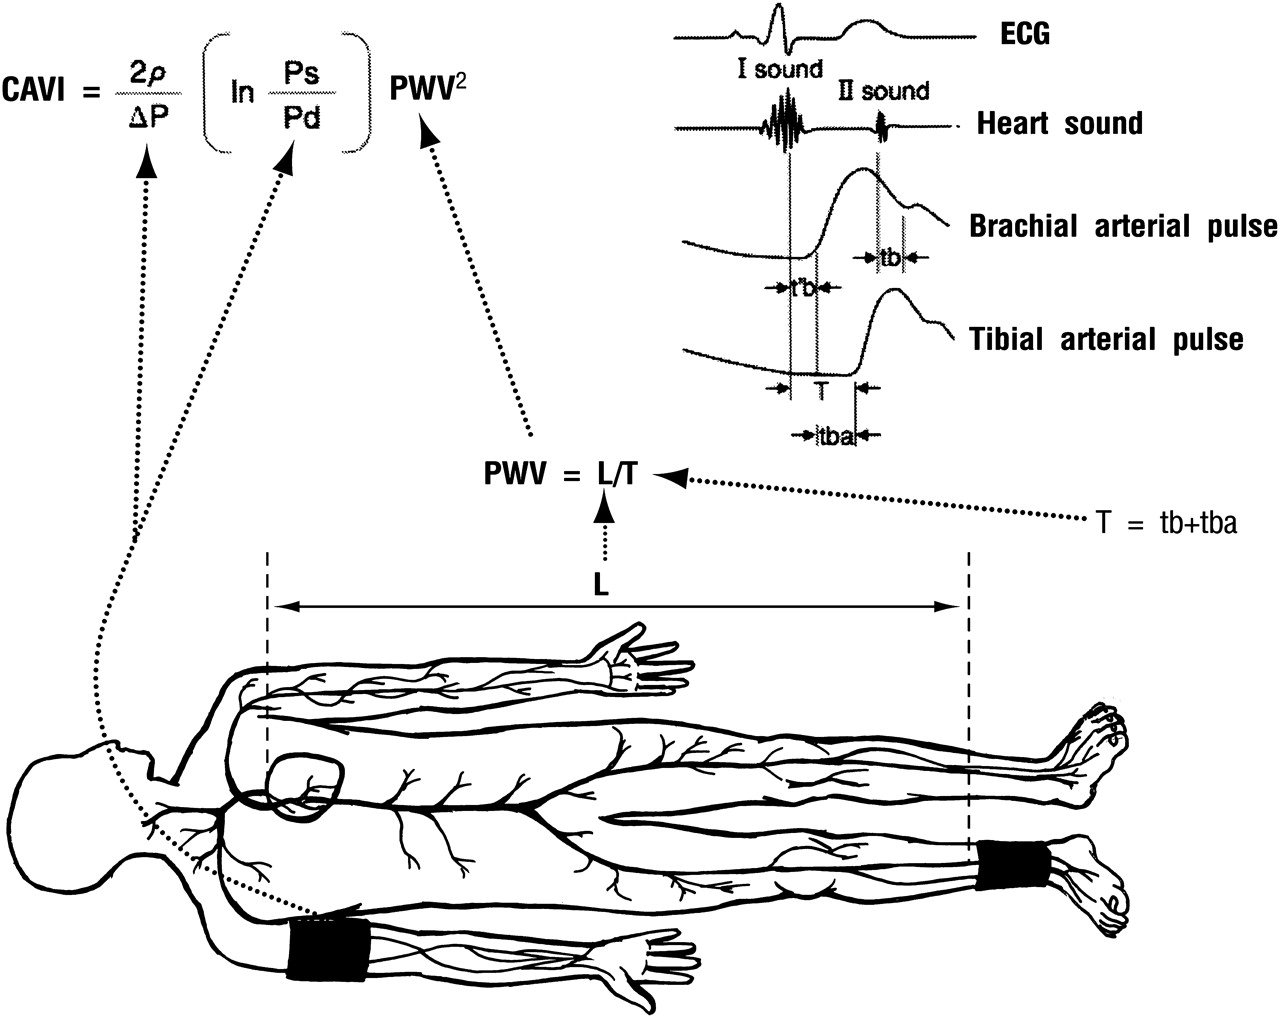
Measurement of cardio-ankle vascular index (CAVI). Patients were placed in the supine position. ECG and phonocardiogram (PCG) were placed to monitor the heart rhythm and heart sound, respectively. Pulse wave velocity (PWV) was obtained by measuring the distance between the aortic valve to the ankle (L) divided by time for the pulse wave to propagate from the aortic valve to the ankle (T). The PWV was then put into the equation for scale conversion. Ps, systolic blood pressure; Pd, diastolic blood pressure; ΔP, Ps−Pd; ρ, blood density; tba, time between rise in brachial pulse wave and rise in ankle pulse wave; tb, time between closing sound of aortic valve and notch in brachial pulse wave; t′b, time between opening sound of aortic valve and rise in brachial pulse wave.
64-slice CT coronary angiography
All of the multislice CT examinations were performed using a 64-slice CT scanner (Sensation 64, Siemens, Forchheim, Germany). If the patient had a heart rate of >70 beats/min, metoprolol 50–100 mg or propranolol 10–20 mg was given 30 min before scanning (or diltiazem 30–60 mg if β-blockers were contraindicated). An initial unenhanced scan was performed for coronary artery calcium scoring.27 A bolus of 80–100 ml of contrast material was administered (iobitridol 350 mg iodine/ml (Xenetix; Guerbel, France) or iopromide 370 mg iodine/ml (Ultravist; Shering AG, Berlin, Germany) and the CT scan was triggered using a bolus tracking technique to synchronise the arrival of the contrast in the coronary arteries. This was followed by CT angiographic acquisition using the following parameters: 64 (32×2) slices per rotation, 0.6 mm detector collimation, tube rotation time 330 ms, table feed of 3.8 mm/rotation and tube voltage 120 kV.
Analysis of MDCT data was performed using multiplanar reconstruction. The datasets were reconstructed during the mid-to-end diastolic phase, with the reconstruction window set at −300 ms to −450 ms before the next R-wave or 60–70% of the R–R interval. In cases of insufficient image quality, additional reconstruction during the end-systolic phase (25–35% of the R–R interval) was performed. Coronary segments were analysed by the American Heart Association classification. Significant coronary stenosis was defined as ≥50% of mean luminal diameter reduction in two orthogonal projections. Moderate coronary stenosis was classified as 50–75% coronary stenosis and severe coronary stenosis as ≥75% coronary stenosis.
Statistical analysis
Continuous data were expressed as mean±SD and compared using the independent t test. Categorical data were expressed as numbers and percentages, and the differences between two groups were compared using the χ2 test. The correlation between CAVI and various clinical parameters was analysed using simple regression analysis. In order to identify the independent risk factors of CAD, multivariate analysis was performed using ordinal logistic regression analysis with the stepwise backward selection method. The sensitivity and specificity of CAVI to detect CAD were analysed using a conventional receiver-operating-characteristic (ROC) curve. The discrimination of the model was evaluated using the concordance (C) statistics, which also represents the area under the ROC curve, and 95% CIs. We also used Net Reclassification Improvement (NRI) as proposed by Pencina et al36 to determine whether the addition of CAVI to the conventional model could significantly increase its ability to predict the presence of CAD. Reclassification tables were constructed using <3%, 3–10% and >10% CAD risk categories according to the Third Adult Treatment Panel.37 A p value of <0.05 was considered statistically significant. Statistical analyses were performed using SPSS software V.17.0 and Stata V.11.0.
Results
Baseline clinical characteristics
A total of 1525 patients were enrolled in the study; 134 patients were excluded (96 due to either contraindication to contrast media or incomplete data collection and 38 due to peripheral arterial disease), resulting in 1391 eligible patients, 635 (45.7%) men and 756 (54.3%) women. Their ages ranged from 31 to 88 years (median 59 years). Of the 1391 patients, 346 (24.87%) had significant coronary stenosis.
The baseline clinical characteristics of the patients are summarised in table 2. Patients with CAD were older and had more traditional risk factors.
Characteristics of the study population and comparisons between patients with and without significant coronary artery stenosis
Relationship between CAVI and CAD
In the entire study population the CAVI value was significantly higher in patients with CAD than in those without CAD (9.7±1.4 vs 7.4±1.5, p<0.001). The CAVI was also significantly higher in patients with single-vessel, double-vessel and triple-vessel diseases than in patients without a coronary lesion (p<0.001). However, the CAVI value did not differ significantly among patients with CAD classified by the number of vessels involved (figure 2).

Relationship between multidetector CT coronary angiography findings and cardio-ankle vascular index (CAVI): 0VD, no vessel disease; 1VD, one-vessel disease; 2VD, two-vessel disease; 3VD, three-vessel disease. Data shown as mean±SD.
Multivariate analysis
After adjustment for age, gender, hypertension, smoking, diabetes, total cholesterol, waist circumference and high density lipoprotein (HDL) cholesterol, the association between CAVI and CAD remained significant (OR 3.3, p<0.001).
ROC curve for the presence of CAD
Using ROC curve analysis, a CAVI of ≥8 (area under the curve 0.87 (95% CI 0.852 to 0.896); p<0.001; sensitivity 92%; specificity 73%; accuracy 79%) was identified as the best cut-off value associated with the presence of CAD (figure 3).
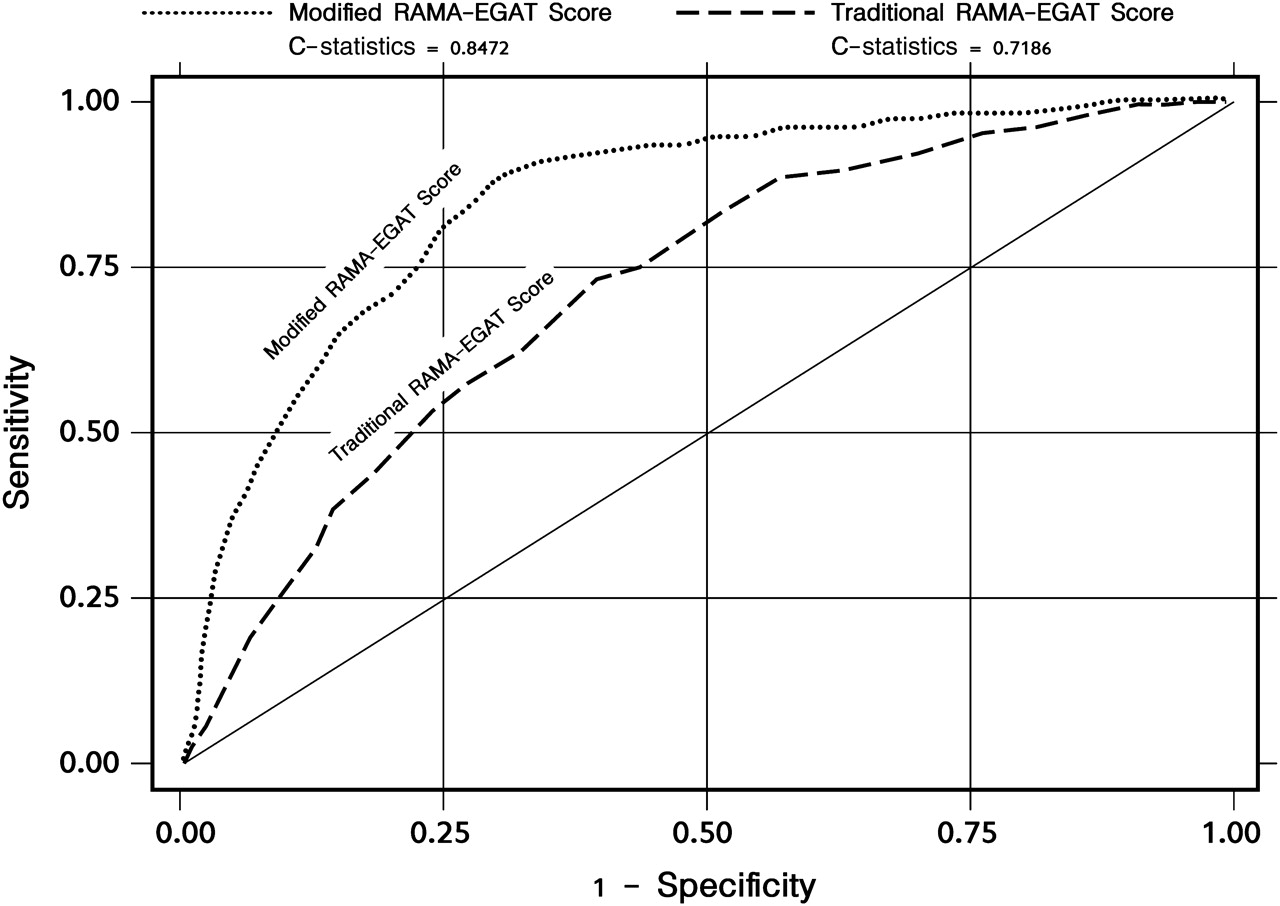
Comparison of receiver operating characteristic (ROC) curve of modified RAMA-EGAT score (EGAT+ cardio-ankle vascular index (CAVI)) and traditional RAMA-EGAT score (EGAT score).
Additive diagnostic value of CAVI to the RAMA-EGAT score
In order to prove the additive value of CAVI over the RAMA-EGAT score for diagnosis of CAD, we developed the ‘modified RAMA-EGAT score’ using multivariable statistical models. The CAVI was put into the model with a point system.38 The modified RAMA-EGAT score model showed good discrimination and performed better than the traditional RAMA-EGAT score, C-statistics of 0.72 (95% CI 0.689 to 0.748) and 0.85 (95% CI 0.825 to 0.870), respectively (figure 3).
We further used the NRI method to evaluate the additive value of CAVI to the RAMA-EGAT score. The reclassification table is shown in table 3. The NRI for the comparison of the modified RAMA-EGAT score with the traditional RAMA-EGAT score was 0.28 (95% CI 0.21 to 0.33, p<0.001).
Calculation of Net Reclassification Improvement (NRI) for the modified RAMA-EGAT score versus the traditional RAMA-EGAT score
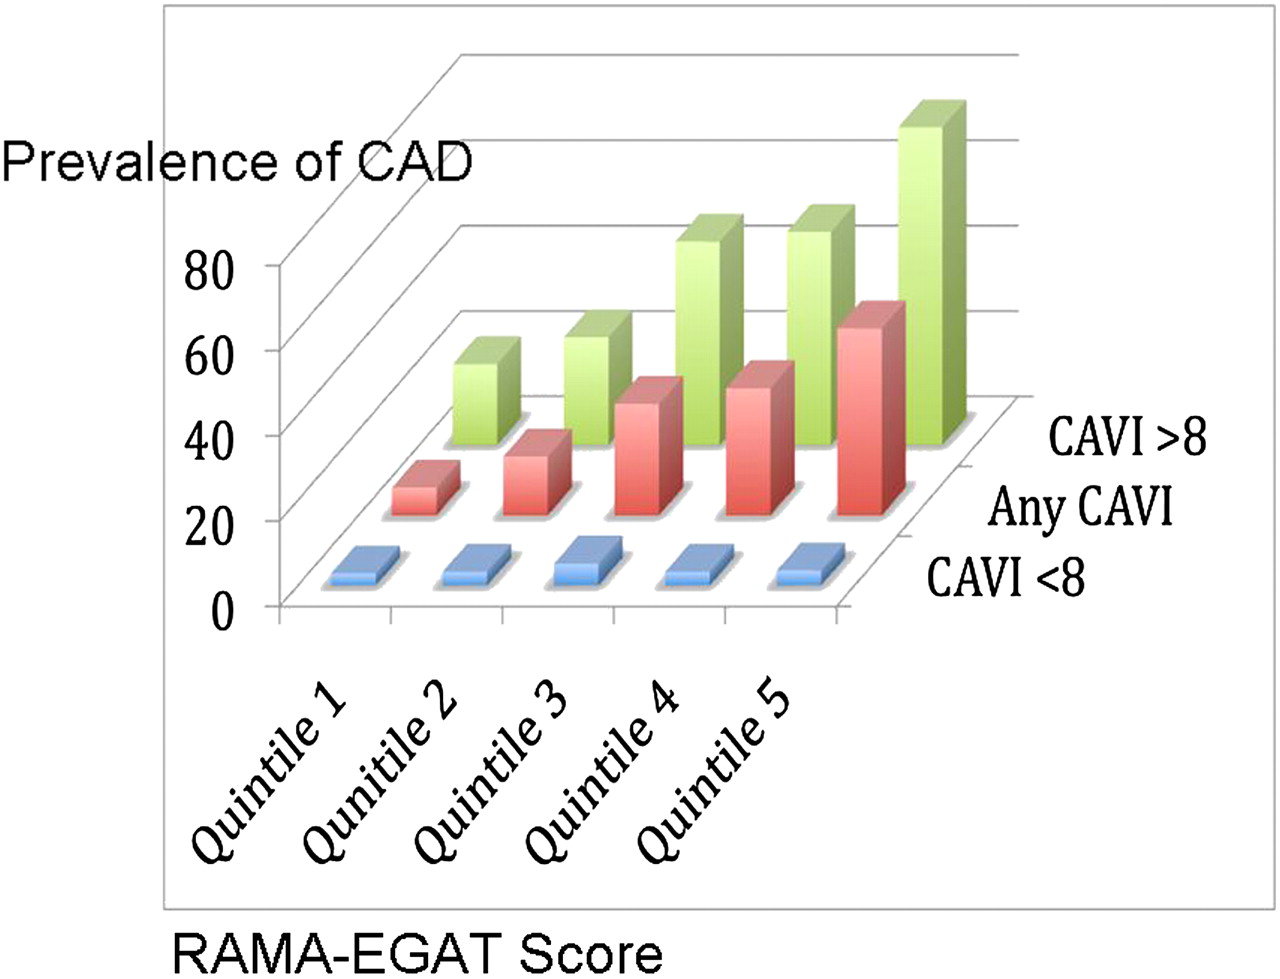
We also divided the RAMA-EGAT score into five quintiles and an increase in the prevalence of coronary stenosis was observed across increasing quintiles. The additive value of CAVI to the RAMA-EGAT score for CAD prediction is shown in figure 4 and is evidence that CAVI can improve the diagnostic yield at all levels of the RAMA-EGAT score.
Cardio-ankle vascular index (CAVI) provides additional diagnostic value at all levels of the RAMA-EGAT score.
Discussion
In this study we have shown a strong and independent association between arterial stiffness assessed by CAVI and the presence of CAD evaluated by 64-slice MDCT. Increased arterial stiffness is associated with several traditional cardiovascular risk factors including age,39–41 smoking,42 hypertension,39 diabetes43 and hypercholesterolaemia.44 In our study population, some of the traditional risk factors (age, male gender and HDL) were accounted for in the multivariate regression analysis model. The information provided by CAVI is therefore independent and complementary to the traditional risk factors.
The findings in our study are consistent with several previous studies linking arterial stiffness to the presence of CAD.27 45 46 Moreover, to our knowledge, this is the largest scale published study to evaluate the association of CAVI and CAD in patients with a moderate to high risk of CAD and it is also the first study in the Thai population, which has made the knowledge of this association much better validated and may be generalisable to other ethnic populations.
Several mechanisms may explain the association between arterial stiffness and CAD. Arterial stiffening may lead to earlier pulse wave reflection causing an increased left ventricular load, myocardial oxygen demand and reduced ejection fraction, thereby inducing left ventricular hypertrophy.47 Additionally, the earlier reflective wave return causes a decrease in diastolic blood pressure which may compromise coronary perfusion resulting in subendocardial ischaemia.48 An elevated pulse pressure due to increased arterial stiffness may induce arterial remodelling, increased wall thickness and the development of plaque.49
With good sensitivity, high negative predictive value and modest specificity, CAVI may be a candidate tool for the screening of CAD in patients in moderate- to high-risk groups. Because the measurement of CAVI is non-invasive, simple, reproducible, widely available and economical, this tool may minimise the necessity for other expensive investigations such as 64-slice MDCT coronary angiography or cardiac catheterisation since, in certain populations, contrast-induced nephropathy50 and the risks associated with ionising radiation51 have raised serious concerns.
CAD is a common cause of death in the Thai population,52 partly as a result of the lack of simple and reliable non-invasive diagnostic tools for atherosclerosis. The additive value of CAVI to the RAMA-EGAT score in predicting CAD demonstrated in our study should encourage practising physicians to integrate CAVI as part of the routine clinical evaluation to improve the diagnostic accuracy of CAD.
Our study has some limitations. The cross-sectional study design inherently limits the conclusion of a causal relationship between CAVI and coronary atherosclerosis. In our study, the presence and extent of CAD was evaluated by 64-slice MDCT coronary angiography rather than the gold standard coronary angiography. The results should therefore be interpreted with caution because of the high false positive rate of MDCT. However, as a screening tool for CAD, this test served our purpose. Further studies to determine the cost-effectiveness of CAVI as a screening tool are warranted.
Conclusion
Arterial stiffness as assessed by CAVI is an independent predictor of CAD in the Thai population and improves the prediction of CAD beyond the traditional risk (RAMA-EGAT) score.
References
Footnotes
Funding This work was supported by the project of Higher Education Research Promotion and National Research University Development, Office of the Higher Education Commission.
Competing interests None.
Patient consent Obtained.
Ethics approval The ethics committee of Ramathibodi Hospital approved the study.
Provenance and peer review Not commissioned; externally peer reviewed.